
The “West” is as much a cultural invention as a geographical construct, so it’s a difficult place to define. Ranging from the driest of deserts to the wettest of rainforests, the lands of Western North America include an incredible diversity of ecosystems and people.
But in many ways, the American West does hang together as a region. The public domain dominates many states and the landscape tends to be much drier than the rest of the country. It is a land with limited water supplies, but vast tracts of open space, a region where extreme topography gives rise to an exceptionally rich array of species.
The West is complex and defies easy categorization, but below I explain EcoWest’s geographic focus and discuss the five characteristics that set the region apart. Links to a supporting PowerPoint deck are at the bottom of this post.
What is the West? from EcoWest on Vimeo.
The 11 Western states
Broadly speaking, EcoWest covers environmental trends in Western North America, but our research has focused on the 11 contiguous Western states: Arizona, California, Colorado, Idaho, Montana, Nevada, New Mexico, Oregon, Utah, Washington, and Wyoming.

Admittedly, this focus excludes parts of Western North America, including Alaska, Western Canada, and Northern Mexico. Some of EcoWest’s resources also cover these areas, but data availability and a need to constrain our research led us to concentrate on 11 states that share some common qualities.
Compared to the rest of the country, I think the 11 Western states stand out in five dimensions:
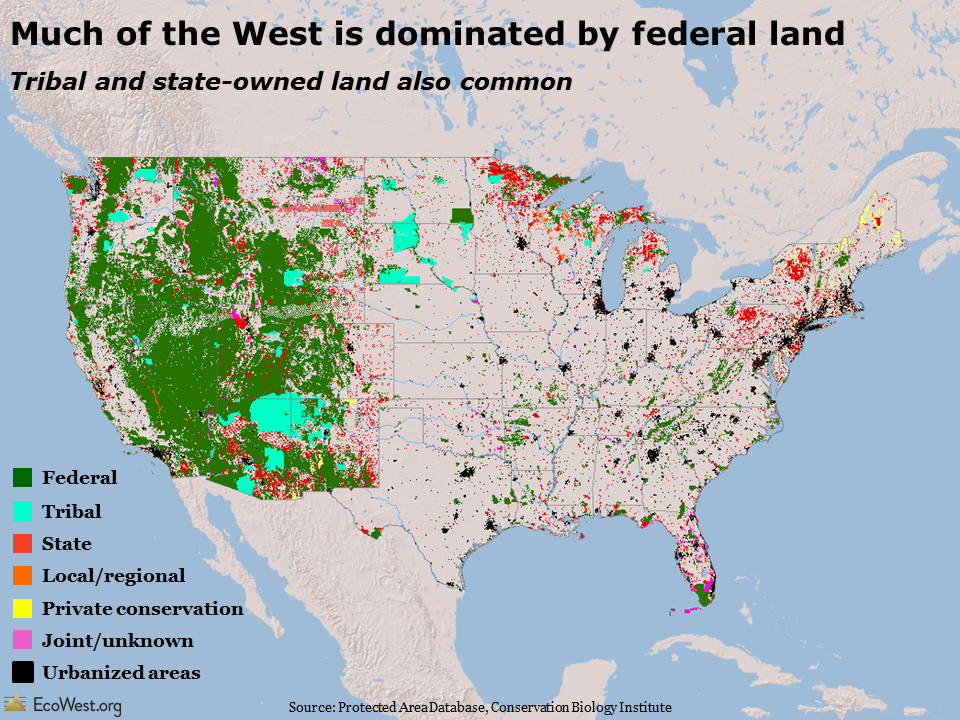
1) Abundant public land
The West’s prevalence of public land—most of it federal—sets the region apart from the rest of the country and has played a pivotal role in its evolution. This pattern of land ownership explains why so much of the West has remained relatively wild. The Bureau of Land Management and Forest Service are the biggest landowners, but the West is also home to considerable tracts of tribal and state property. Public lands certainly aren’t immune to development pressures, especially because many are managed under the “multiple use” doctrine that allows grazing, mining, logging, energy development, motorized recreation, and other human activities. But all that public land is a major reason why so much of the West is unpopulated.
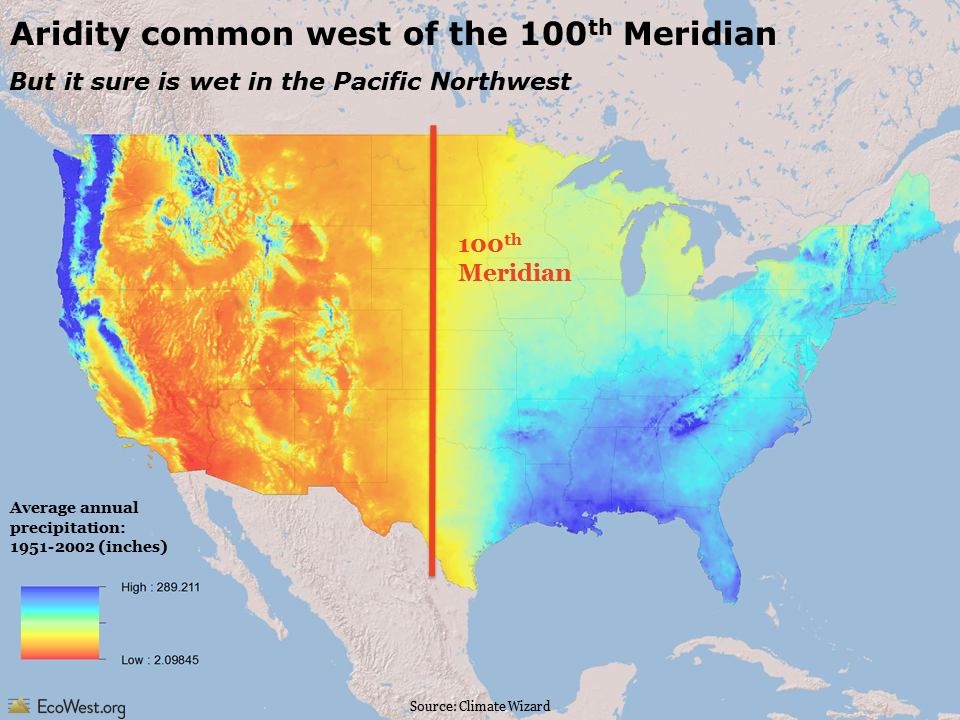
2) Aridity, with some exceptions
As you move west across the United States, the climate generally gets drier, with the notable exceptions of the Pacific Coast, Cascade Mountains, and Sierra Nevada Range. West of the 100th Meridian, irrigation is usually required to support agriculture and river flows tend to depend on melting snowpack from the mountains. Every Western state includes some very arid terrain that is far drier than anything back East, even Washington and Oregon, where the Cascade Mountains cast a stark rain shadow. Another striking feature of the West’s climate is the spottiness of precipitation patterns and the close proximity of wet and dry areas.
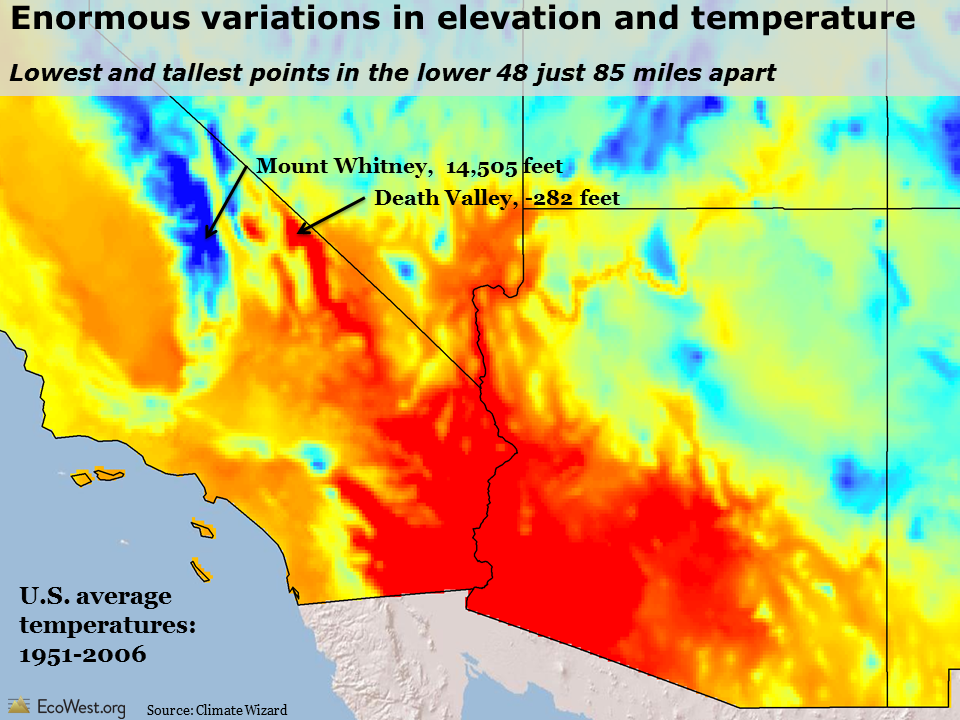
3) Rollercoaster topography
The West’s huge variance in precipitation is matched by its wild swings in temperature. Much of this is due to the region’s legendary topography. For example, the scorching desert of Death Valley, 282 feet below sea level and the lowest point on the continent, is only 85 miles away from the snow-capped peak of Mount Whitney, 14,505 feet above sea level and the tallest point in the contiguous 48 states.
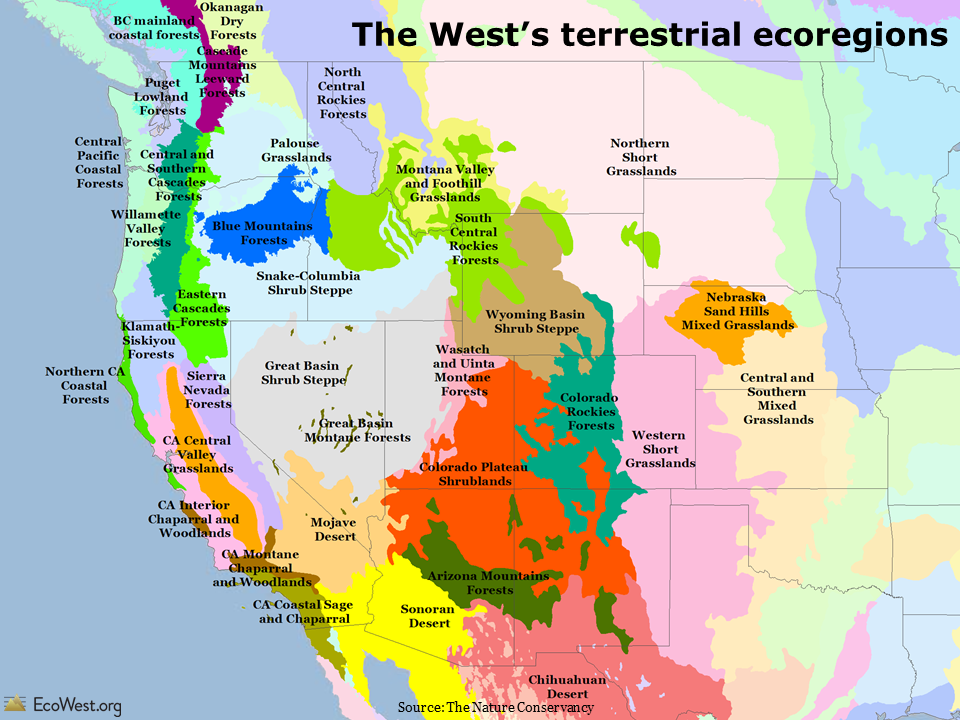
4) Diversity of species and ecosystems
The broad spectrum of elevations, temperatures, and precipitation patterns explains why the West is home to such a diverse set of ecosystems and species. In Southern Arizona, for instance, the valley bottoms are deserts filled with cacti, but the mountain ranges are two miles above sea level and support lush forests harboring moss and mushrooms. The map below shows the West’s various ecoregions, each of which is a unique ecological neighborhood that supports an impressive diversity of plants and animals, many of them found nowhere else on the planet.
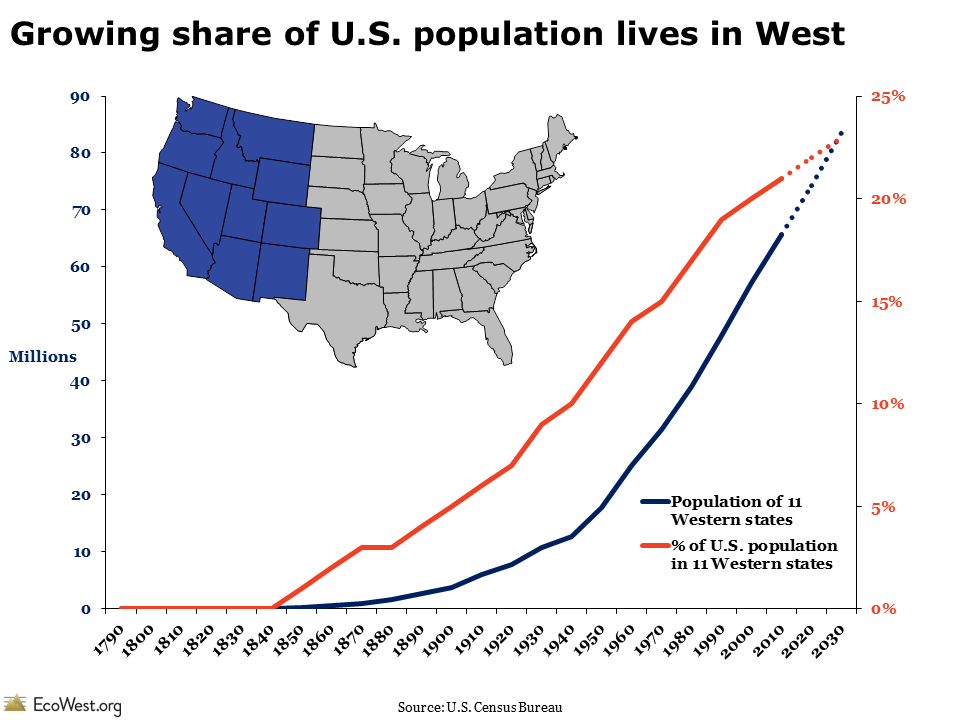
5) Growing population
The preceding four factors are natural ones and are as true today as they were centuries or even millennia ago. But a final, human factor is also worth noting. The West’s population has been booming for decades. By 2030, the region is expected to be home to a quarter of all Americans, up from essentially 0 percent in 1830 and 9 percent in 1930. To be sure, other parts of the United States, such as the South, are also growing. But the steady influx of new residents in the West—and their growing demands on natural resources—is the fundamental challenge facing the region and the leitmotif in its environmental history.
How would you define the West?
Defining the region as the 11 Western states has some shortcomings. Wildlife doesn’t respect lines on maps. Issues like the Keystone XL pipeline and the environmental impact of the border fence in the Southwest highlight how Canada, the United States, and Mexico are economically and ecologically integrated. We had to draw the line somewhere, but I’d be curious to hear feedback on this decision.
Likewise, I wonder if the five factors I describe above are the right ones. Are there other geographical, physical, cultural, political, or social dimensions that define the West?
Downloads
- Download Slides: What is the West? (6099 downloads )
- Download Notes: What is the West? (6331 downloads )
EcoWest’s mission is to analyze, visualize, and share data on environmental trends in the North American West. Please subscribe to our RSS feed, opt-in for email updates, follow us on Twitter, or like us on Facebook.

