If the Oregon Department of Fish and Wildlife pays to restore Chinook salmon habitat in Upper Klamath Lake, does it have an economic connection to an urbanite some 300 miles north in a Portland coffee shop?
The answer is yes, according to “The Conservation Economy in America,” a report commissioned by the National Fish and Wildlife Foundation.
The report, which examines the economic implications of spending by governments and the private sector to support conservation in the United States, shows that conservation investments ripple far beyond their initial investments. Based on the analysis, an estimated $38.8 billion is spent annually on conservation in the United States. Thanks to the multiplier effect, that direct spending leads to more than $93 billion of total economic activity in the country, including the generation of 660,000 jobs, $41.6 billion in salaries and wages, and $12.8 billion in tax revenues.
Southwick Associates, which produced the report, sums up their conclusions this way:
The money invested in supporting natural resource conservation […] provide much more than mere recreational benefits for those who hunt, fish or watch wildlife. These investments actually serve as a powerful driver of economic benefits that generate a positive ripple effect throughout the American economy.
Defining conservation investments
What qualifies as a conservation investment? In the context of this study, “natural resource conservation” refers to actions to protect or manage native fish and wildlife species, as well as land and water acquisitions to protect their habitats. The analysis does not include spending related to outdoor recreation, municipal parks, environmental education, historic preservation, or conservation spending outside the United States.
So what are actual examples of conservation spending? A public-sector expenditure could include payments from the U.S. Department of Agriculture to compensate landowners who improve wildlife habitat on agricultural land, through the Wildlife Habitat Incentive Program.
The report defines private-sector investments as conservation spending by nonprofit organizations, calculated based on the organizations’ annual Form 990 tax returns. Private sector spending could include, for instance, tree planting events carried out by the organization American Forests. (Additional details on the study’s methodology and data sources are available in the full report.)
Disparate contributions across states
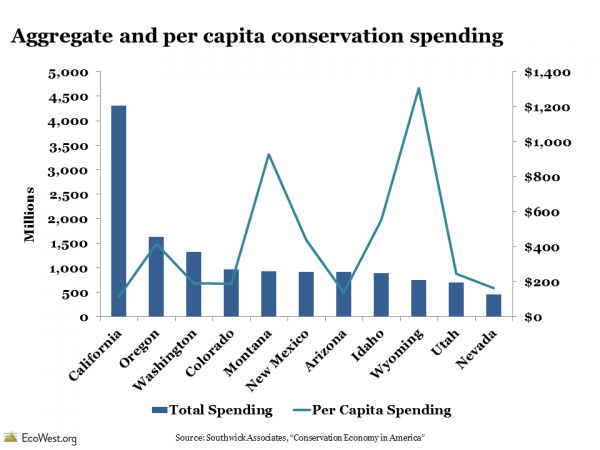
In terms of conservation spending, not all states are created equally. Conservation spending is highest in California, with $4.3 billion in direct investments, as compared to the lowest level of $108 million in Rhode Island. These figures include the direct effects of conservation spending across all sectors, through the immediate jobs, income, and tax revenues associated with the expenditures.
Total direct economic contributions of conservation spending, by state 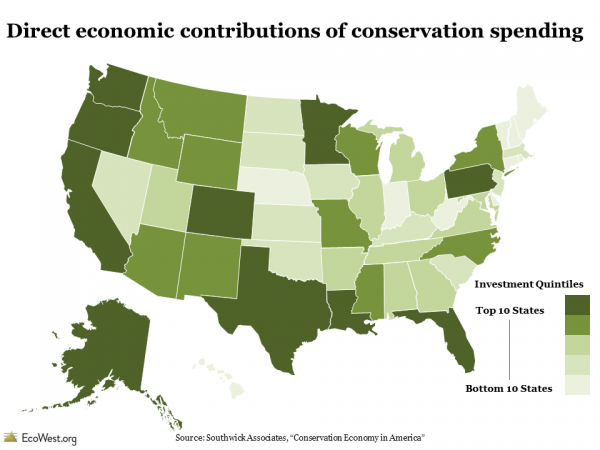
If we consider per capita spending, we see that California actually drops to the lowest rank in the West, with $113 in spending, while a sparsely populated state like Wyoming climbs to the top at $1,306.
Aside from population, it’s not clear which variables explain the state-by-state differences in spending levels. One could hypothesize that the amount of federal lands in a state or the effectiveness of its lobbying efforts might influence the scale of federal dollars allocated to states, but the report didn’t draw any statistical inferences or speculate on this question.
Economic impacts beyond the check
Since spending is not limited to direct contributions alone, the study also measured indirect contributions of conservation spending, referring to the wider economic activities that result from the direct expenditures. For example, trail restoration activities by the Yosemite Conservancy may lead the organization to purchase equipment and hire an environmental engineer to conduct a watershed analysis for the ecologically sensitive site. Analysts at Southwick Associates used the IMPLAN model to estimate the jobs, income, and taxes that are generated as a result of these direct investments.
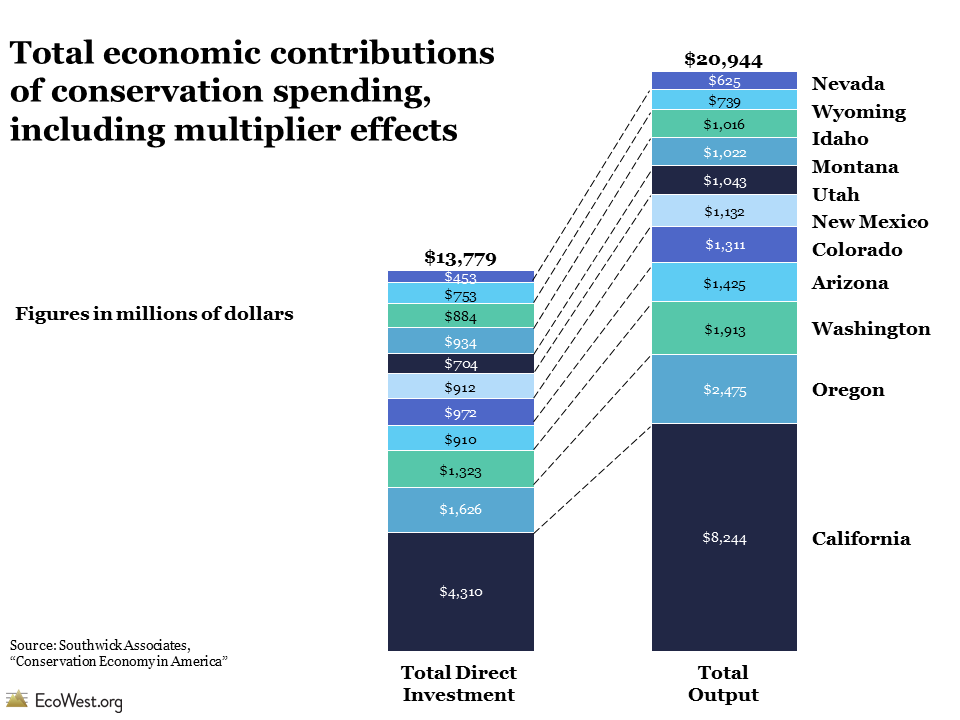
Nationwide, spending of $38.8 billion yielded a total economic output of $93.2 billion in 2011 (a ratio of 42 percent). In the West, $13.7 billion in direct conservation investments generated $20.9 billion of total economic activity in 2011 (a ratio of 66 percent).
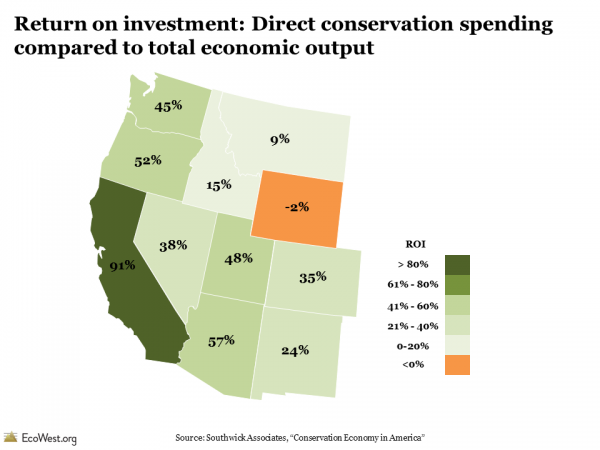
In all but three states nationwide (Wyoming, South Dakota, and Texas), conservation investments yield higher economic returns than the costs of the original investment. In the big picture, these findings help rebut the classic “environment versus the economy” paradigm.
Incomplete price tag on nature
This report highlights that the impact of U.S. conservation spending is significant, and probably on a scale that is under-appreciated by most Americans.
At the same time, it’s worth noting that report evaluated only a narrow slice of the conservation economy. The value of ecosystem services, such as clean air and water, were excluded from the study, yet they carry a staggering economic value. One 1997 study of the world’s ecosystem services and natural capital estimated the value at $16-54 trillion dollars per year.
Valuation of natural resources is a burgeoning field and experts are developing new tools for evaluating how conservation investments can deliver wider societal benefits and lead to improved economic outcomes.
Data sources
You can download the full report, “The Conservation Economy in America: Direct investments and economic contributions” from Southwick Associates.
Downloads
- Download Slides: Conservation Spending (5577 downloads )
- Download Notes: Conservation Spending (5500 downloads )
- Download Data: Conservation Spending (4440 downloads )
EcoWest’s mission is to analyze, visualize, and share data on environmental trends in the North American West. Please subscribe to our RSS feed, opt-in for email updates, follow us on Twitter, or like us on Facebook.
