Tag Archives: wildlife

Q&A: Financing land conservation in the West

EcoWest recently had an opportunity to speak with Dee Frankfourth, Associate National Conservation Finance Director at The Trust for Public Land (TPL) and Eleanor Morris, Senior Policy Representative at The Nature Conservancy (TNC). We interviewed Frankfourth and Morris about trends they are observing in their conservation finance work to protect open space across the West.

 Both TNC and TPL, along with local land trusts and other partners, secure public funding for conservation in the West and elsewhere through open space ballots and legislative initiatives.

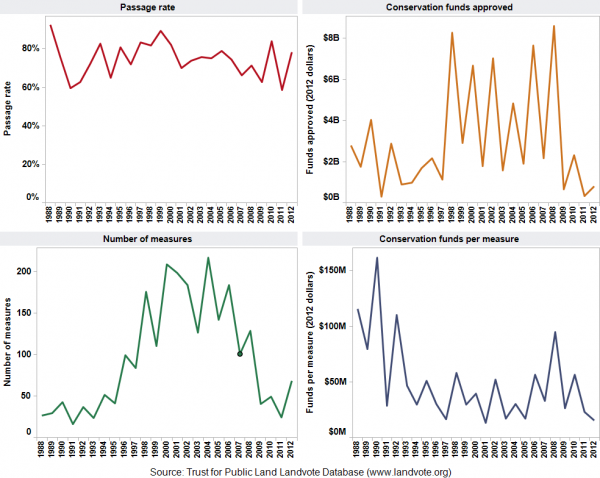
Conservation finance initiatives occur in two ways. First, the public can vote directly on a ballot measure to approve a new funding source (e.g., a bond, income tax, property tax, oil and gas revenues, or lottery proceeds). Second, legislatures can approve funding through a budget line item or general fund appropriation. You can learn more about conservation finance initiatives in this EcoWest post or on this dashboard (click the screen shot below to enlarge).
Ballot measure dashboardBelow is an edited Q&A with Frankfourth and Morris.

EcoWest: Can you highlight any conservation finance initiatives that have recently passed in the West?

Dee Frankfourth (TPL): Most measures in the West occurred in their primaries during May and August of this year, including:

  • Blaine County, Idaho: This county, located near Sun Valley, passed a $3.5 million property tax to reconstruct the 20-mile Wood River recreational trail. This is actually quite a significant amount for a rural county, and it passed overwhelmingly, with 83 percent approval.
  • Portland, Oregon: With 54% of the vote, the metro area of Portland that includes parts of three counties passed a $50 million property tax for stewardship of lands acquired during two previous bond measures, and to fund other open space acquisitions.
  • King County, Washington: This county surrounding Seattle, the 17th largest in the nation,  passed by 70% a six-year property tax that will start at $60 million in the first year and increase annually. The measure will help keep county parks and trails in good condition and also provide funding to protect new open spaces.

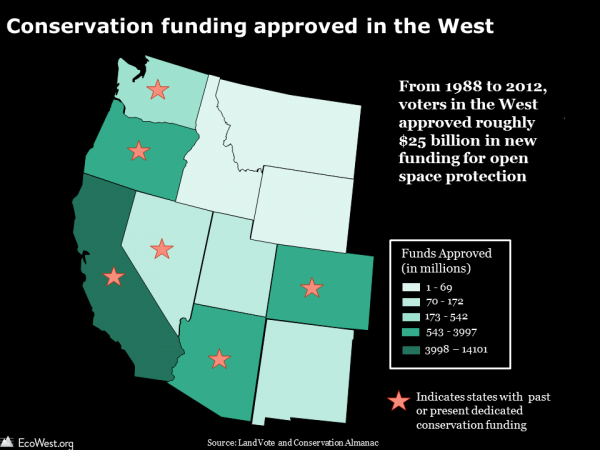
The graphic below, based on TPL’s LandVote database, shows that Western voters approved some $25 billion in conservation funding from 1988 to 2012.

Conservation funding in the West

EcoWest: Given that water is arguably the most precious natural resource in the West, have you observed a link between the public’s willingness to conserve land and their motivation to protect water resources?

Eleanor Morris (TNC): I’m constantly impressed that this connection is instantaneous for Americans. It’s a no-brainer—they intuitively understand, “If I protect this piece of land, then I protect my drinking water.” And this is not a new trend necessarily. Water has always been a huge driving force in conservation finance in the West. It consistently ranks as a top reason in polls as to why people are motivated to pay for land protection

EcoWest: Federal funding programs play a key role in making conservation finance initiatives possible. Have recent financial challenges in D.C. presented any threats to these funding sources?

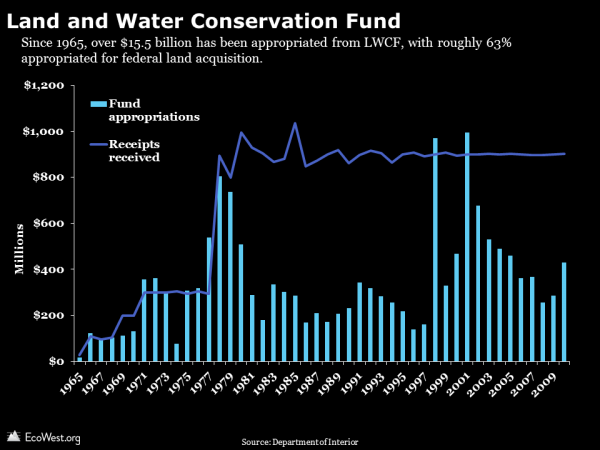
Dee Frankfourth (TPL): The trendline in general for federal funding is definitely of concern. The Land and Water Conservation Fund (LWCF) is slated to end in 2015, since it was initially designed as a 50-year dedicated funding source. TPL and our partners are currently working to build allies in Congress to ensure leadership for either a renewal of this fund or a new source that supplants it. The federal government provides an important value proposition to states: “We’ll give you [the state] 50 percent of funding if you put in the other half for a conservation project.”

The graphic below summarizes LWCF appropriations and receipts. Learn more about how the LWCF works in this report from the Congressional Research Service.

EcoWest LWCF graphic

EcoWest: Eleanor, can you tell us about the Montana Legacy Project, the nation’s largest private conservation purchase? Are there any key lessons learned from TNC’s efforts to protect those 310,000 acres?

Eleanor Morris (TNC): Yes, this project had an innovative and unprecedented funding package from the federal government, Montana state government, and private sources. On-the-ground support from the public was another important feature that made this deal possible. TNC and our partners worked in counties that were already 80 to 90 percent public land. It took concerted effort to work with communities in these counties and discuss how they envision their future land use.

EcoWest: Have you observed a trend of “conservation envy” in your work – where one county creates a dedicated source of conservation funding, and an adjacent county seeks to follow suit?

Dee Frankfourth (TPL): Yes, there is currently a county in southeastern Washington undertaking the process to create a dedicated pot of conservation funding. This is a great example of a county, in a very conservative part of the state, looking next door at Spokane, seeing how they are protecting their parks, open space, and natural areas with a dedicated fund  created  20 years ago, and thinking how it should do the same. After TPL presented to elected officials in the county last March, we performed feasibility research this summer and found that it would cost $11 per household annually (less than $1 per month) to create a dedicated conservation funding source. The next step is to conduct a public opinion survey of registered voters to see if there is sufficient support to warrant moving ahead with a ballot measure.

EcoWest: How might growing concern about fire and drought as threats to local water supplies influence TNC’s work going forward?

Eleanor Morris (TNC): Last year, the City of Flagstaff, Arizona approved a $10 million bond to protect nearly 15,000 acres of forest land outside the city’s limits. This was an important measure showing that voters were willing to tax themselves to protect national forest land for watershed services. TNC is now developing strategies to look at whole watersheds, whole ecosystems, whole landscapes. We’re looking at the entire state of Oregon, and the bulk of the state of New Mexico. The aim is to protect lands beyond the reach of one individual city, in order to safeguard all water resources that might be connected to an area’s water supply.

Editor’s note: The David and Lucile Packard Foundation, which supports EcoWest.org, has funded TPL, TNC, and the Montana Legacy Project, but the foundation does not exert editorial control over this website.

Downloads

EcoWest’s mission is to analyze, visualize, and share data on environmental trends in the North American West. Please subscribe to our RSS feed, opt-in for email updates, follow us on Twitter, or like us on Facebook.

Tracking the ripple effects of conservation spending

If the Oregon Department of Fish and Wildlife pays to restore Chinook salmon habitat in Upper Klamath Lake, does it have an economic connection to an urbanite some 300 miles north in a Portland coffee shop?

The answer is yes, according to “The Conservation Economy in America,” a report commissioned by the National Fish and Wildlife Foundation.

The report, which examines the economic implications of spending by governments and the private sector to support conservation in the United States, shows that conservation investments ripple far beyond their initial investments. Based on the analysis, an estimated $38.8 billion is spent annually on conservation in the United States. Thanks to the multiplier effect, that direct spending leads to more than $93 billion of total economic activity in the country, including the generation of 660,000 jobs, $41.6 billion in salaries and wages, and $12.8 billion in tax revenues.

Southwick Associates, which produced the report, sums up their conclusions this way:

The money invested in supporting natural resource conservation […] provide much more than mere recreational benefits for those who hunt, fish or watch wildlife. These investments actually serve as a powerful driver of economic benefits that generate a positive ripple effect throughout the American economy.

Defining conservation investments

What qualifies as a conservation investment? In the context of this study, “natural resource conservation” refers to actions to protect or manage native fish and wildlife species, as well as land and water acquisitions to protect their habitats. The analysis does not include spending related to outdoor recreation, municipal parks, environmental education, historic preservation, or conservation spending outside the United States.

So what are actual examples of conservation spending? A public-sector expenditure could include payments from the U.S. Department of Agriculture to compensate landowners who improve wildlife habitat on agricultural land, through the Wildlife Habitat Incentive Program.

The report defines private-sector investments as conservation spending by nonprofit organizations, calculated based on the organizations’ annual Form 990 tax returns. Private sector spending could include, for instance, tree planting events carried out by the organization American Forests. (Additional details on the study’s methodology and data sources are available in the full report.)

Disparate contributions across states

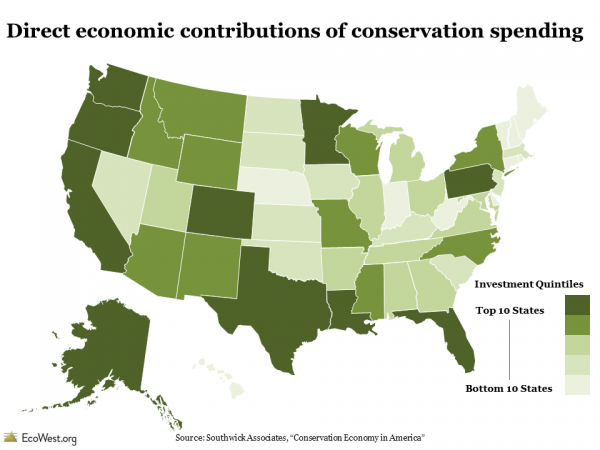
In terms of conservation spending, not all states are created equally. Conservation spending is highest in California, with $4.3 billion in direct investments, as compared to the lowest level of $108 million in Rhode Island.  These figures include the direct effects of conservation spending across all sectors, through the immediate jobs, income, and tax revenues associated with the expenditures.

Total direct economic contributions of conservation spending, by state Total direct economic contributions of conservation spending, by state

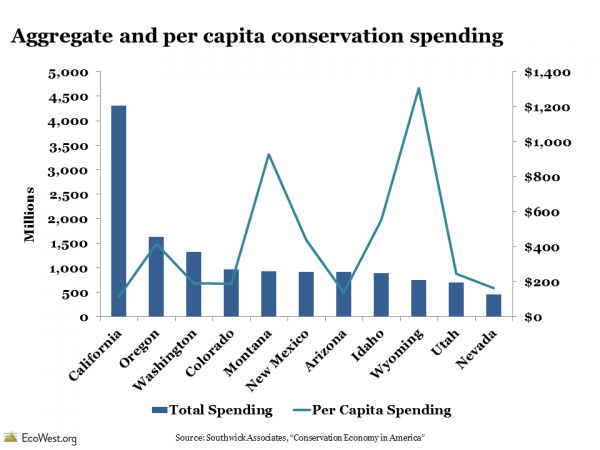
If we consider per capita spending, we see that California actually drops to the lowest rank in the West, with $113 in spending, while a sparsely populated state like Wyoming climbs to the top at $1,306.

Aggregate and per capita conservation spending

Aside from population, it’s not clear which variables explain the state-by-state differences in spending levels. One could hypothesize that the amount of federal lands in a state or the effectiveness of its lobbying efforts might influence the scale of federal dollars allocated to states, but the report didn’t draw any statistical inferences or speculate on this question.

Economic impacts beyond the check

Since spending is not limited to direct contributions alone, the study also measured indirect contributions of conservation spending, referring to the wider economic activities that result from the direct expenditures. For example, trail restoration activities by the Yosemite Conservancy may lead the organization to purchase equipment and hire an environmental engineer to conduct a watershed analysis for the ecologically sensitive site. Analysts at Southwick Associates used the IMPLAN model  to estimate the jobs, income, and taxes that are generated as a result of these direct investments.

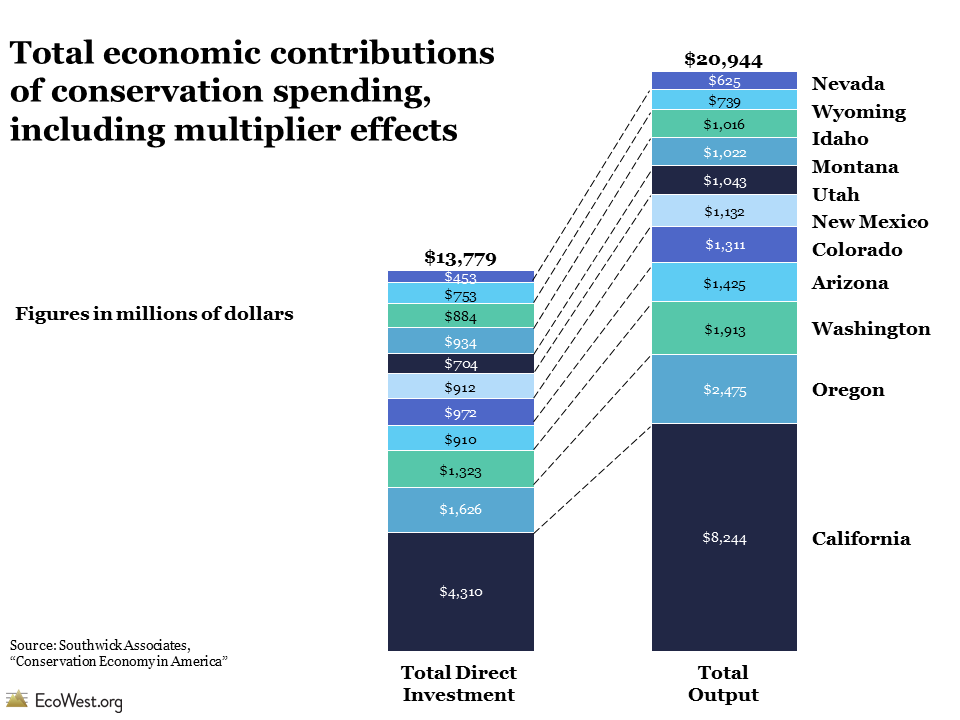
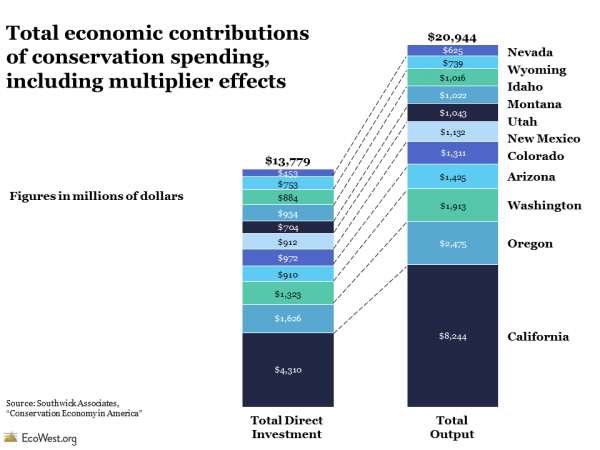
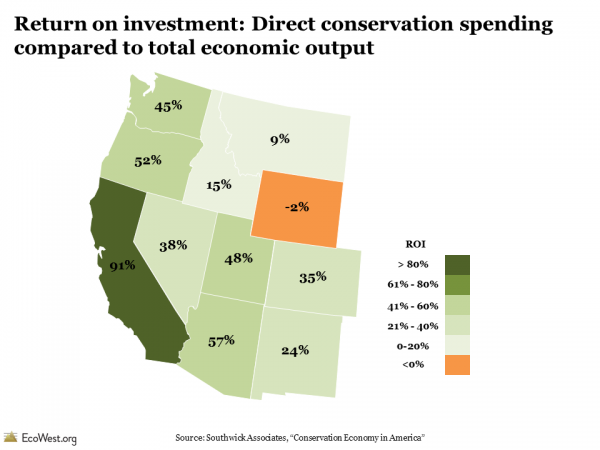
Nationwide, spending of $38.8 billion yielded a total economic output of $93.2 billion in 2011 (a ratio of 42 percent). In the West, $13.7 billion in direct conservation investments generated $20.9 billion of total economic activity in 2011 (a ratio of 66 percent).

Total economic contributions of conservation spending, including multiplier effects

In all but three states nationwide (Wyoming, South Dakota, and Texas), conservation investments yield higher economic returns than the costs of the original investment. In the big picture, these findings help rebut the classic “environment versus the economy” paradigm.

Return on investment: Direct conservation spending compared to total economic output

Incomplete price tag on nature

This report highlights that the impact of U.S. conservation spending is significant, and probably on a scale that is under-appreciated by most Americans.

At the same time, it’s worth noting that report evaluated only a narrow slice of the conservation economy. The value of ecosystem services, such as clean air and water, were excluded from the study, yet they carry a staggering economic value. One 1997 study of the world’s ecosystem services and natural capital estimated the value at $16-54 trillion dollars per year.

Valuation of natural resources is a burgeoning field and experts are developing new tools for evaluating how conservation investments can deliver wider societal benefits and lead to improved economic outcomes.

Data sources

You can download the full report, “The Conservation Economy in America: Direct investments and economic contributions” from Southwick Associates.

Downloads

EcoWest’s mission is to analyze, visualize, and share data on environmental trends in the North American West. Please subscribe to our RSS feed, opt-in for email updates, follow us on Twitter, or like us on Facebook.
Human footprint maps of Western states and cities

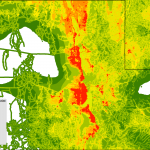
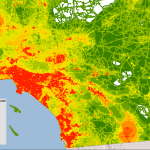
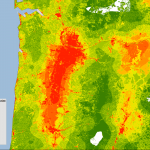
Just a quick post to let you know that I’ve created a gallery of high-resolution maps depicting the human footprint in each of the 11 Western states, plus some major cities in the region.

I wrote about this dataset a few weeks ago and wanted to share some more detailed, zoomed-in views. White indicates areas with the least human impact, followed by green for places where the footprint is minimal, while orange and red areas are where people have done the most to transform native ecosystems.

Below is the gallery, which also available on this page.

The human footprint map is based on the work of U.S. Geological Survey (USGS) scientists and was the basis of a 2008 paper in Ecological Applications by Matthias Leu, Steven E. Hanser, and Steven T. Knick. The scientists focused on 14 features, including the location of cities, farms, roads, canals, power lines, oil and gas wells, and human-caused wildfires.

Please let me know if you have any issues viewing the maps. This is the first time I’ve used the WordPress gallery feature and I’m wondering if it’s an effective tool for sharing images.

Same goes for anything on EcoWest: as we get off the ground, we’re looking for feedback, suggestions, and other comments from users so we can make this site as useful as possible. Thanks!

EcoWest’s mission is to analyze, visualize, and share data on environmental trends in the North American West. Please subscribe to our RSS feed, opt-in for email updates, follow us on Twitter, or like us on Facebook.