All posts by Emily Peterson

EIA’s portal compares energy sector in 50 states

If you’ve ever been curious about energy facts in your state—such as which sector consumes the most energy, or how your state’s electricity prices compare to the rest of the country—the State Portal hosted by the U.S. Energy Information Administration (EIA) is a convenient, user-friendly resource.

EIA’s portal compares energy in the 50 states from EcoWest on Vimeo.

In a previous EcoWest post, we highlighted another useful data visualization tool, Saxum’s United States of Energy map, which illustrates energy production and known fuel deposits around the country. The EIA web portal offers an interactive tool with state-level energy data and detailed profiles for each state. It also aggregates data on state rankings of energy consumption, production, and prices across sectors and fuel types. Users can create customized energy infrastructure maps, visualize state-level data by generating graphics and charts, and analyze key energy statistics for each state.

In this post, we’ll use the state of Montana as an example to highlight the range of information that the EIA portal provides. From the main landing page, you can select Montana to display the state’s profile overview. Under the “Layers/Legend” menu item, you can choose from over 30 infrastructure layers, including coal plants, hydroelectric plants, natural gas pipelines, transmission lines, and LNG export terminals.

Below are five outputs from the portal that we found especially useful.

1)     State energy rankings

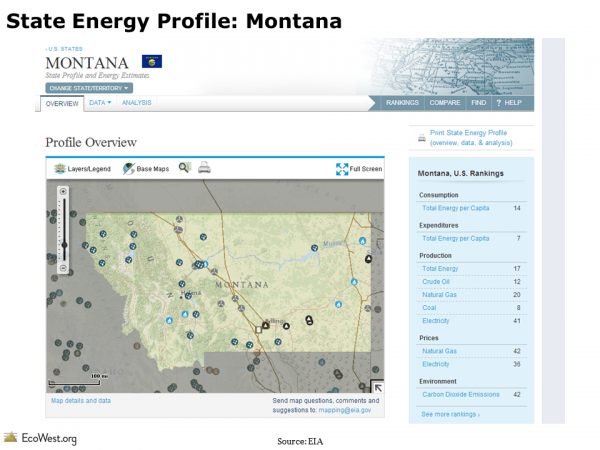
For easy reference, the portal provides a chart on the state profile page to indicate how that state ranks against all other U.S. states in terms of energy consumption, production, pricing, expenditures, and emissions. As you can see from the screenshot below, Montana is the country’s eighth largest producer of coal. The state emits a relatively low level of carbon dioxide, mostly owing to its sparse population.

State Energy Profile: Montana

2)     Energy production by source

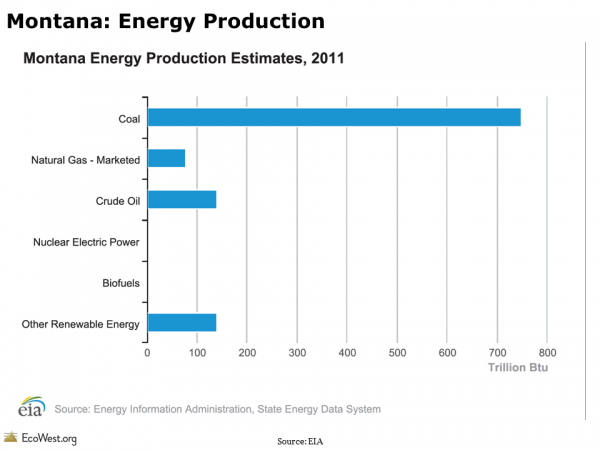
As shown in chart below, coal dominates energy production in Montana. The state is home to the country’s largest estimated recoverable coal reserves. Roughly one-quarter of the coal mined in Montana is consumed in-state for electric power; two-fifths is distributed domestically to more than 15 states; and one-third is exported, mainly to Asia.

Montana: Energy Production

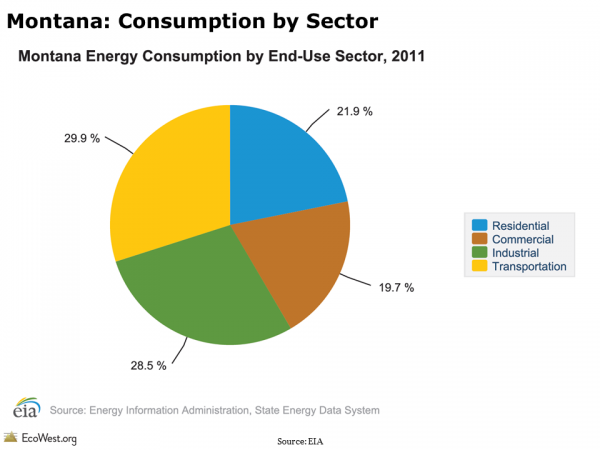
3)    Energy consumption by sector

You can also view the breakdown of energy consumption by sector for each state. In Montana, the transportation and industrial sectors account for roughly three-fifths of energy use. At the national level, the industrial and transportation sectors are also the leading energy users.

Montana: Consumption by Sector

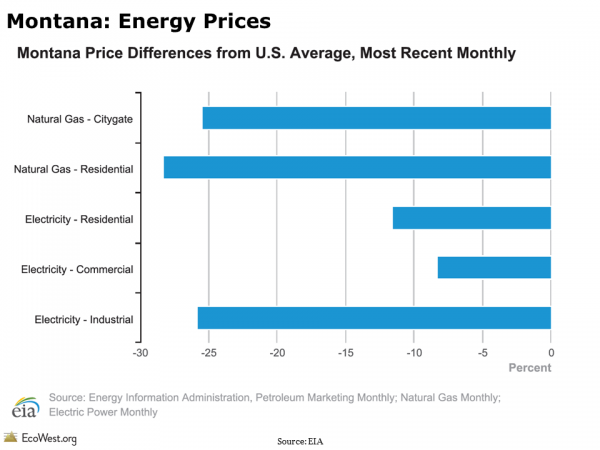
4)    State energy prices compared to U.S. average

It’s also interesting to compare how energy prices in your state stack up against other states. In Montana, energy prices are about 25 percent lower than the national average. These low prices are primarily a result of a stable supply of energy produced in-state and a relatively low demand from the state’s comparatively small population.

Montana: Energy Prices

5)    Renewable energy potential

Montana is well-situated, geographically speaking, for renewable energy production. The state has significant hydroelectric potential from rivers flowing out of the Rocky Mountains. And across its wide plains, the state has the third highest commercial wind potential in the country.

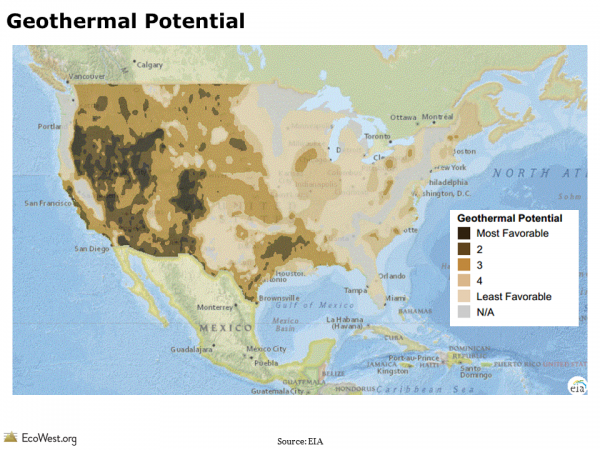
On the EIA state portal, you can map renewable energy potential by source across the country. As this map shows, Montana has significant geothermal potential, particularly in the state’s mountainous southwest corner. Currently, geothermal resources are largely untapped as an electricity source in Montana, a fact which many attribute to the state’s low fossil fuel energy prices, small population, and lack of transmission infrastructure in remote locations.

Geothermal Potential

Given its frequency of updates and user-friendly format, the EIA portal is a handy resource for academics, decision-makers, and residents who are keen to learn more about their state’s energy portfolio. Take a tour of the portal and let us know what you learn about your state.

Data sources

EIA’s state energy portal provides state-level energy data and infrastructure overlays for all 50 U.S. states.

Downloads

EcoWest’s mission is to analyze, visualize, and share data on environmental trends in the North American West. Please subscribe to our RSS feed, opt-in for email updates, follow us on Twitter, or like us on Facebook.

Climate change and trends in the American West’s snowpack

Like anglers who can dutifully pinpoint the location of hotspots, winter sports enthusiasts know when and where to find the best snow. When conditions change in the slightest—whether in temperature, base depth, or type of snow—devotees take note. But it can be hard to tell whether conditions on the local slopes in a given season reflect mere chance or long-term changes in global climate patterns.

In a previous post, we explored how rising greenhouse gas emissions will take an economic toll on snow-dependent sports. A 2012 report by two advocacy groups, the Natural Resources Defense Council and Protect Our Winters, provided an indicator of how climate change may impact snow sports. The study estimated that the $12.2 billion winter sports industry has already felt the pinch of decreased snowpack and escalating average winter temperatures; under a business-as-usual trajectory, future scenarios appear even bleaker (see our dashboard of their data).

In this post, we dive deeper into what the science is telling us about climate-driven trends in the Western snowpack.

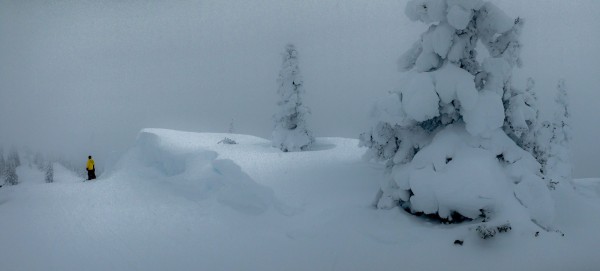
Snow drifts on Continental Divide
Snow drifts on Continental Divide at Monarch Mountain Ski Area. Photo by Mitch Tobin.

Observed trends in mountain snowpack

In the coming decades, changes to the West’s snowpack will create ripple effects far beyond the ski slopes. Near-term changes in the region’s hydrological cycle will impact water supplies, forest health, agricultural productivity, and the food supply. The bulk of the flow in most Western rivers comes from melting snow.

Describing changes in snow hydrology, one climate scientist framed it succinctly: “Shorter snow season, less snow overall, but the occasional knockout punch. That’s the new world we live in,” said Michael Oppenheimer of Princeton University.

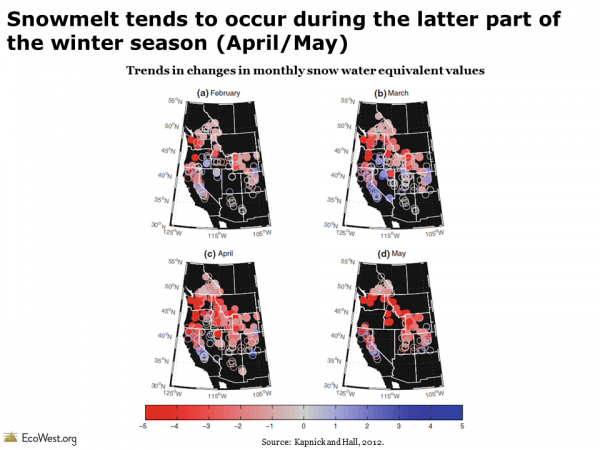
To measure how the snowpack has been changing, scientists often gauge snow levels on April 1st, which is when the snowpack usually reaches its basin-wide maximum in the West. The amount of April 1st snow water equivalent (SWE) has shown a downward trend in recent decades: across the Cascades of the Pacific Northwest and in much of California, the SWE level has decreased 20% compared with 80 years ago.

Snowmelt tends to occur earlier

Scientists have shown that most of the large-scale reductions in snowpack have been related to rising temperatures. Temperatures have warmed by 2 degrees Fahrenheit in the Rocky Mountains and by 1.7 degrees in the Sierras.

According to Anne Nolin, professor of geosciences and hydroclimatology at Oregon State University, the spring snowpack has been declining by 1.5-2% per decade over the past several decades. While this amount may not sound like a steep change, it is significant enough to cause economic losses for the ski areas most vulnerable to a changing climate, such as those at lower elevations and in the warm extents of the Pacific Northwest.

Though overall projections anticipate a consistent decline in Western snowpack over the 21st century, these are difficult predictions to make given the great variability in snowfall from place to place and year to year. As winter sports fans are well aware, resorts separated by only a few miles can receive vastly different snow totals from a single storm.

Another challenge scientists face is the lack of long-term datasets. One key source is SNOTEL, which is operated by the Natural Resource Conservation Service and tracks variables such as precipitation, temperature, snow depth, and soil moisture at more than 600 sites in 13 states. However, the installation of SNOTEL began in the mid-1970s, and thirty years can be a narrow window for distinguishing between climatic changes and natural variability. For this reason, many climate scientists rely on temperature data, which tends to be less variable than precipitation data and which can reveal broader patterns based on 30-50 years of measurement.

Future trends: more rain, less snow, and earlier snowmelt

Under a business-as-usual scenario, winter temperatures are projected to warm by an additional 4-10 degrees Fahrenheit by the end of this century, which could lead to a 25-100% decline in snow depths in the West.

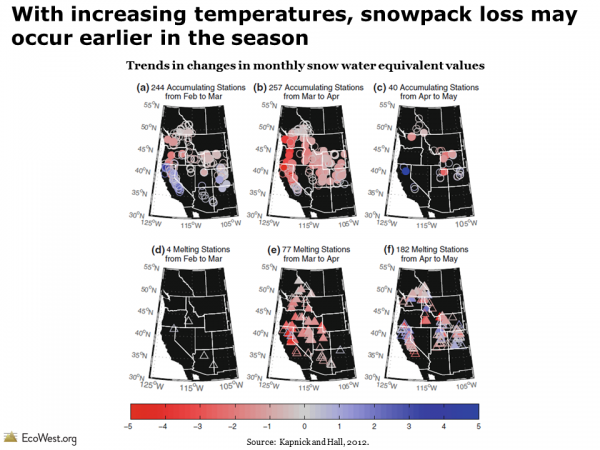
Snowpack loss may occur earlier

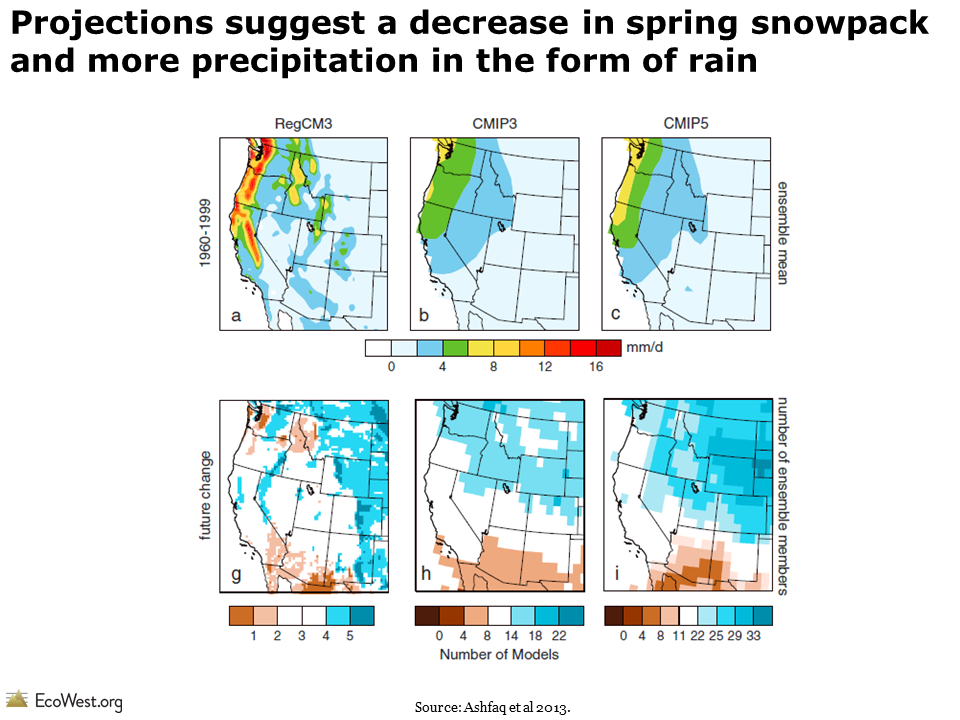
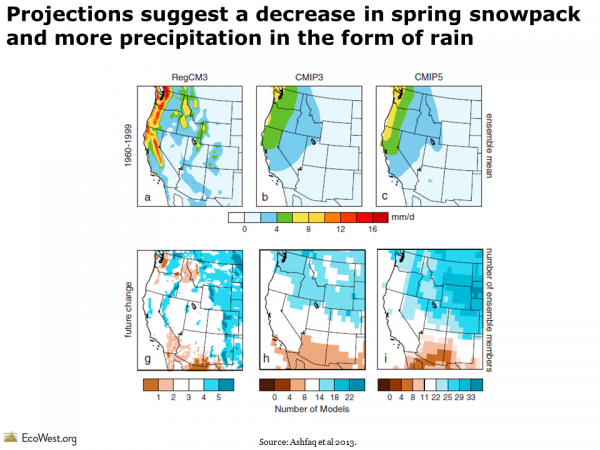
Although there is still considerable uncertainty, models predict a decrease in spring snowpack, a transition from snow to more rain, and a reduction in summertime streamflows across the West. By 2040, increased temperatures could melt most of the snowpack in the Sierras and Colorado Rockies by April 1st.

Hydroclimatic change

Mountainside winners and losers of climate change

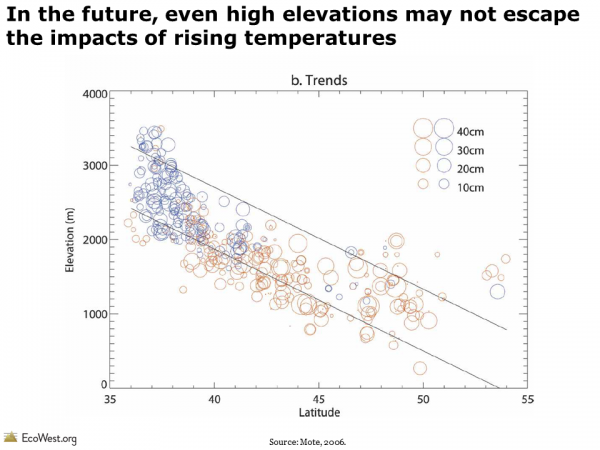
The impacts of a changing climate will play out differently across the West. Lower elevation areas, such as the Pacific Northwest, are more sensitive to warming temperatures and may be the first locations to feel the impact of snow turning to rain. On the other hand, Colorado has some built-in resilience since it has more ski slopes above 9,000 feet than any other Western state. But over the long term, even high-elevation locations may not be immune to the impacts of a changing climate.

Elevation, latitude, and snowfall

In the near term, the first victims of climate change in the winter sports industry are likely to be the roughly 300 small mom-and-pop ski resorts. Many of these operations are situated at lower elevations and operate on slim financial margins. While megaresorts can compensate for low-snow years with extensive snowmaking infrastructure, smaller mountains may find such systems beyond their financial reach.

If mom-and-pop ski areas go under, it could have a big impact on the future of the American ski industry. These smaller resorts are sometimes referred to as “feeder breeders” because they provide an entry point for people learning to ski and snowboard before they graduate to steeper slopes on bigger mountains or in the backcountry.

While winners and losers may emerge in the near term, ultimately the entire winter sports industry could suffer if the shrinking snowpack turns skiing and snowboarding into fringe activities. “Colorado may have a strategic advantage,” said Nolan Doesken, state climatologist for Colorado, “but if there’s not a national or international interest in winter sports, it could ultimately disadvantage even Colorado. When the entire country struggles with snow and the demand for skiing is lower, the whole industry is at risk.”

Climate contradiction: more blizzards, but less snow overall

During the climate bill discussions in the Senate in 2010, climate change skeptic Senator James Inhofe (R-OK) constructed an igloo on the Capitol Lawn during the record Mid-Atlantic snowstorm, coined “snowpocalypse.” While Inhofe meant to suggest that climate change is hoax, scientists in fact have been warning for some time that a world with warming temperatures is poised to trigger more potent blizzards.

Since a warmer atmosphere can hold more moisture, it is reasonable to expect an upward trend in extreme winter precipitation, in the form of both rain and snow. During the past 50 years, the United States has seen twice as many extreme snowstorms as experienced during the previous 60 years.

“Strong snowstorms thrive on the ragged edge of temperature—warm enough for the air to hold lots of moisture, meaning lots of precipitation, but just cold enough for it to fall as snow,” said Mark Serreze, director of the National Snow and Ice Data Center. “Increasingly, it seems that we’re on that ragged edge.”

Data sources

Downloads

EcoWest’s mission is to analyze, visualize, and share data on environmental trends in the North American West. Please subscribe to our RSS feed, opt-in for email updates, follow us on Twitter, or like us on Facebook.
How energy is produced in the American West, the nation’s “energy breadbasket”

The Western Governors’ Association (WGA) calls the West the nation’s “energy breadbasket,” owing to the region’s vast and diverse energy resources. In its most recent report, “The State of Energy in the West,” the WGA provides a comprehensive survey of conventional and renewable energy as part of its year-long focus on energy.

In a previous post, we explored how energy consumption, spending, and prices compare in Western states and across the country. In this post, we shift our focus to the supply side to understand how energy is produced in the West. (Also see our post on the “United States of Energy,” a map that illustrates where the nation’s energy resources are located.)

Energy breadbasket of the U.S.

The West, which the WGA defines as a 19-state region extending as far east as Texas and South Dakota, plays a key role in meeting the country’s energy demands. The WGA dubbed the West the nation’s energy breadbasket for several reasons:

  • The West delivers nearly two-thirds of the nation’s wind energy.
  • California is the national leader in solar energy production, its output nearly triple that of the next highest-producing state (Arizona). Solar energy potential in the Southwest also ranks among the highest in the world.
  • Nearly all of the country’s geothermal resources are located in the West, home to 99.5% of installed national capacity in 2011.
  • In recent years, the West has accounted for close to 70% of the country’s natural gas and petroleum production.
  • Coal production in the West contributes 60% of the national total.

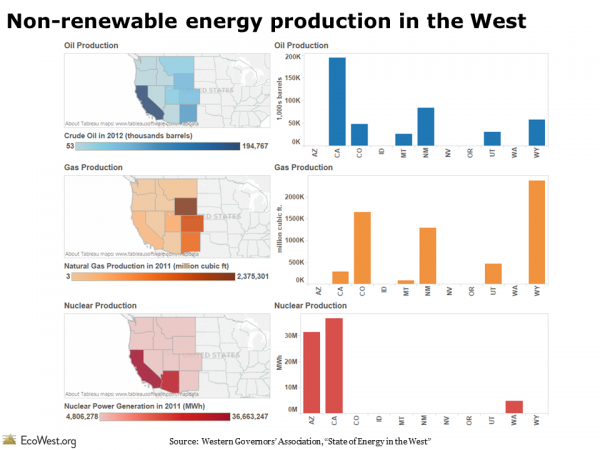
Below is a screenshot (click to enlarge) from our dashboard illustrating energy production in the West, based on 2012 figures.
Non-renewable energy production in the West
Renewable energy production in the West

Energy and the economy

Fossil fuels currently make up the largest share of state-level employment in the West’s energy sector. In 2009, the oil and gas industry accounted for more than 5% of total employment in Alaska, Colorado, Montana, New Mexico, and Wyoming. The coal industry in Wyoming is responsible for 14.2% of the state’s GDP and 8% of its work force in 2010. The state’s total coal output exceeds Russia’s.
Oil and gas as a share of employment, by state
Besides generating jobs, the fossil fuel industry also contributes to the region’s economy through severance taxes, which are applied to the extraction of some non-renewable resources. Five states in the West–Alaska, Colorado, Montana, New Mexico, and Wyoming–have a severance tax endowment, which provides a revenue stream in perpetuity. Among all state-level severance taxes collected across the nation in 2011, roughly 85 % were in the West.

The growing renewable energy industry is also spurring job growth in the region. The wind industry alone has added 30,000 jobs throughout the West and generated over $290 million in property tax revenues.

Energy vision for the West

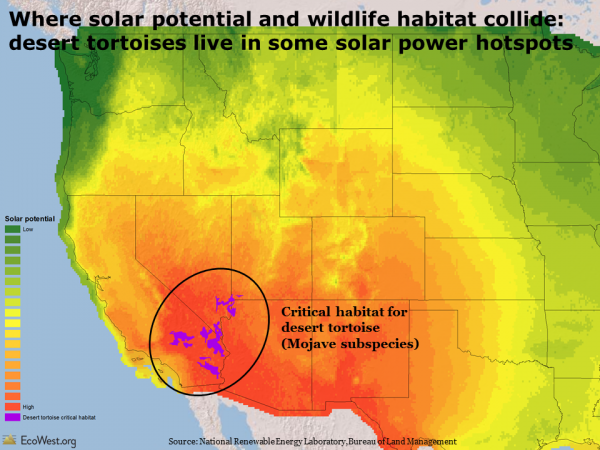
The West’s abundant energy resources play a pivotal role in both the regional and national economy, but energy development also carries environmental costs. Researchers have cautioned that energy sprawl can threaten the habitats of iconic western species, such as the sage grouse and pronghorn. The graphic below, from our land deck, shows the intersection of desert tortoise critical habitat and solar power potential.
Solar energy potential and desert tortoise habitat
As part of its 10-Year Energy Vision, the WGA is working to achieve a balance between responsible energy development and wildlife conservation by engaging in more proactive planning with various stakeholders.

The WGA’s State of the Energy report provides an accessible primer on energy resources in the West, in addition to reviewing topics such as energy efficiency, alternative vehicles/fuels, electricity transmission, and technology development in the sector. Given that the West provides a majority of the nation’s energy supply, the report should be useful for policymakers and residents living in and outside the West.

Data sources

The Western Governors’ Association, a non-partisan organization of 22 U.S. governors, represents 19 U.S. states and 3 U.S. territories. EcoWest typically defines the region as the 11 contiguous Western states, but “The State of Energy in the West” takes a broader view.

Downloads

EcoWest’s mission is to analyze, visualize, and share data on environmental trends in the North American West. Please subscribe to our RSS feed, opt-in for email updates, follow us on Twitter, or like us on Facebook.