Tag Archives: wind

How energy is produced in the American West, the nation’s “energy breadbasket”

The Western Governors’ Association (WGA) calls the West the nation’s “energy breadbasket,” owing to the region’s vast and diverse energy resources. In its most recent report, “The State of Energy in the West,” the WGA provides a comprehensive survey of conventional and renewable energy as part of its year-long focus on energy.

In a previous post, we explored how energy consumption, spending, and prices compare in Western states and across the country. In this post, we shift our focus to the supply side to understand how energy is produced in the West. (Also see our post on the “United States of Energy,” a map that illustrates where the nation’s energy resources are located.)

Energy breadbasket of the U.S.

The West, which the WGA defines as a 19-state region extending as far east as Texas and South Dakota, plays a key role in meeting the country’s energy demands. The WGA dubbed the West the nation’s energy breadbasket for several reasons:

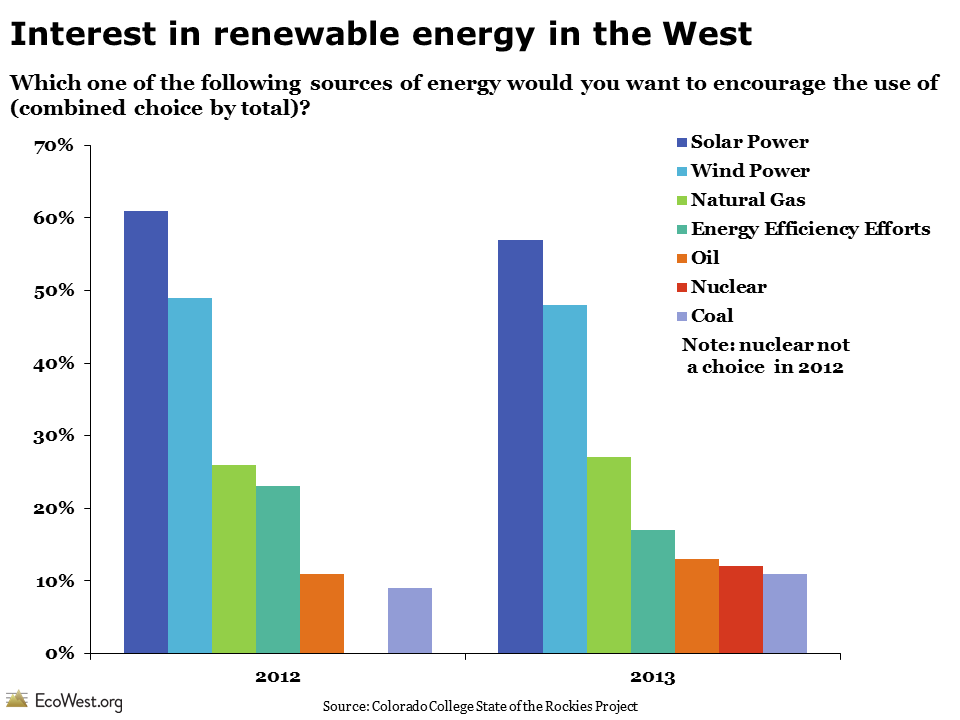
  • The West delivers nearly two-thirds of the nation’s wind energy.
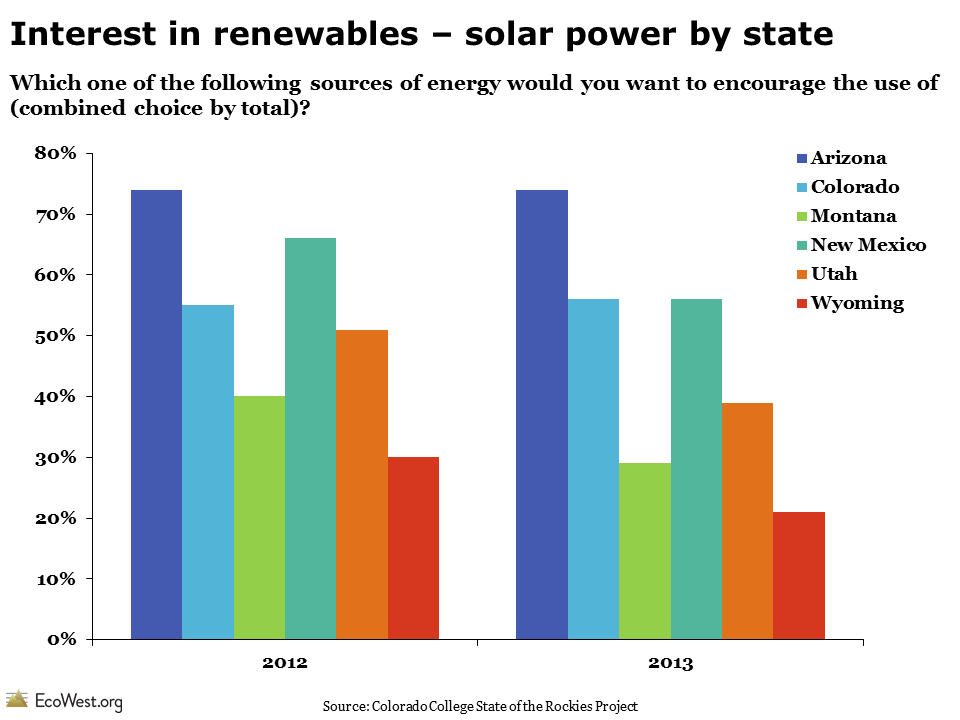
  • California is the national leader in solar energy production, its output nearly triple that of the next highest-producing state (Arizona). Solar energy potential in the Southwest also ranks among the highest in the world.
  • Nearly all of the country’s geothermal resources are located in the West, home to 99.5% of installed national capacity in 2011.
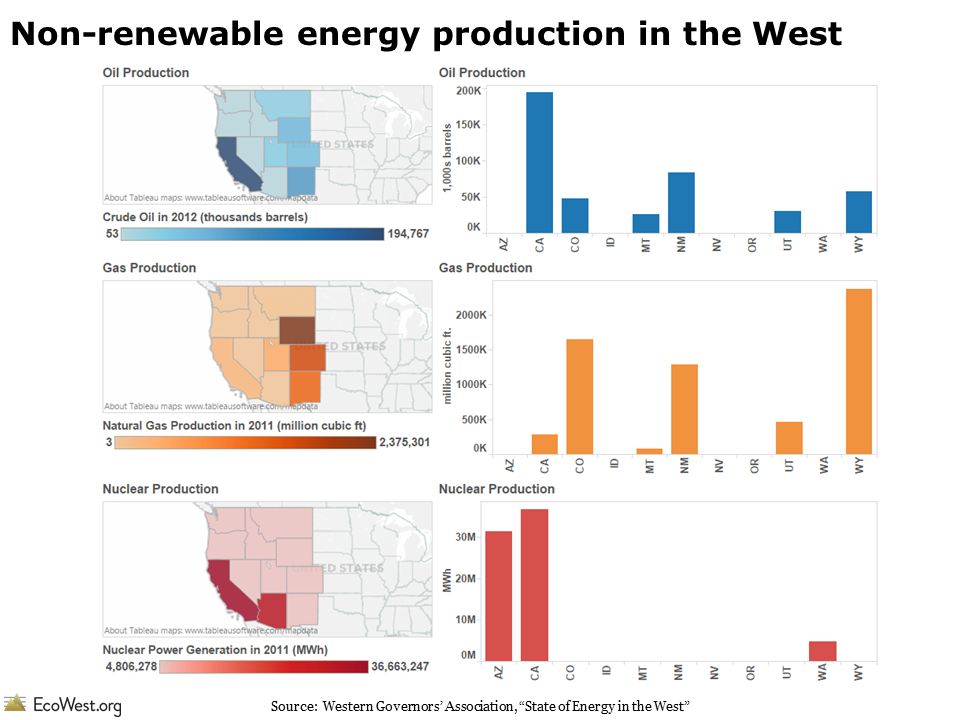
  • In recent years, the West has accounted for close to 70% of the country’s natural gas and petroleum production.
  • Coal production in the West contributes 60% of the national total.

Below is a screenshot (click to enlarge) from our dashboard illustrating energy production in the West, based on 2012 figures.
Non-renewable energy production in the West
Renewable energy production in the West

Energy and the economy

Fossil fuels currently make up the largest share of state-level employment in the West’s energy sector. In 2009, the oil and gas industry accounted for more than 5% of total employment in Alaska, Colorado, Montana, New Mexico, and Wyoming. The coal industry in Wyoming is responsible for 14.2% of the state’s GDP and 8% of its work force in 2010. The state’s total coal output exceeds Russia’s.
Oil and gas as a share of employment, by state
Besides generating jobs, the fossil fuel industry also contributes to the region’s economy through severance taxes, which are applied to the extraction of some non-renewable resources. Five states in the West–Alaska, Colorado, Montana, New Mexico, and Wyoming–have a severance tax endowment, which provides a revenue stream in perpetuity. Among all state-level severance taxes collected across the nation in 2011, roughly 85 % were in the West.

The growing renewable energy industry is also spurring job growth in the region. The wind industry alone has added 30,000 jobs throughout the West and generated over $290 million in property tax revenues.

Energy vision for the West

The West’s abundant energy resources play a pivotal role in both the regional and national economy, but energy development also carries environmental costs. Researchers have cautioned that energy sprawl can threaten the habitats of iconic western species, such as the sage grouse and pronghorn. The graphic below, from our land deck, shows the intersection of desert tortoise critical habitat and solar power potential.
Solar energy potential and desert tortoise habitat
As part of its 10-Year Energy Vision, the WGA is working to achieve a balance between responsible energy development and wildlife conservation by engaging in more proactive planning with various stakeholders.

The WGA’s State of the Energy report provides an accessible primer on energy resources in the West, in addition to reviewing topics such as energy efficiency, alternative vehicles/fuels, electricity transmission, and technology development in the sector. Given that the West provides a majority of the nation’s energy supply, the report should be useful for policymakers and residents living in and outside the West.

Data sources

The Western Governors’ Association, a non-partisan organization of 22 U.S. governors, represents 19 U.S. states and 3 U.S. territories. EcoWest typically defines the region as the 11 contiguous Western states, but “The State of Energy in the West” takes a broader view.

Downloads

EcoWest’s mission is to analyze, visualize, and share data on environmental trends in the North American West. Please subscribe to our RSS feed, opt-in for email updates, follow us on Twitter, or like us on Facebook.

Annual Western poll shows strong support for conservation

For the past few years, Colorado College’s State of the Rockies Project has been conducting a Conservation in the West poll, and the results continually show strong support for protecting the West’s environment.

When voters in six states are asked about issues such as energy development, safety regulations, and public lands, they tend to prefer renewable technologies, keeping a close watch on business, and protecting open space for habitat and recreation. But there are some interesting regional differences, especially when it comes to energy.

We’ve created a short PowerPoint presentation, available for download at the bottom of this post, that summarizes some findings from the Conservation in the West polls. You can also view the slide deck in this embed:

Annual poll of Western voters shows strong support for conservation from EcoWest on Vimeo.

Limited sources on Western environmental public opinion

In an earlier post, we discussed the national-level results from Gallup’s polling on the environment. In some cases, Gallup has been asking the same question over and over, year after for year, for decades.

Unfortunately, we haven’t found any comparable public opinion surveys of the West that offer such a lengthy time series. Some states in the region have longstanding surveys, such as California’s Field Poll, which was established in 1947. The Public Policy Institute of California also puts out a yearly poll on the environment.

But when it comes to understanding how Westerners think about things like wildlife, carbon regulations, and the water supply, the best source we’ve found is Colorado College’s yearly polls. Here’s how The New York Times summed up the 2013 results:

Nine in ten people polled said that national parks, forests, monuments and wildlife preserves are essential to the economy. Three in four said that those lands furnish good jobs, and more than seven in 10 said that no public lands should be sold to private corporations. Three in five said that drilling should not be allowed in “critical locations” near recreation areas, water sources or wildlife. Only 35 percent said that more public lands should be opened to “responsible energy development.

In tandem with two pollsters (Lori Weigel of Public Opinion Strategies and Dave Metz of Fairbank, Maslin, Maullin, Metz & Associates), Colorado College conducted a survey of 2,400 voters in six Western states:  Arizona, Colorado, Montana, New Mexico, Utah and Wyoming.

Environment vs. economy: false dichotomy?

Although we hear a lot about the environment versus the economy, nearly 80 percent of respondents said we can simultaneously protect land and water while maintaining a strong economy.

State of the Rockies Conservation in the West Poll Environment vs. Economy

Below are the results from a similar question, which asked respondents whether they favored “reducing protections on land, air, and water” that apply to businesses in order to help the economy and generate jobs as quickly as possible. Fewer than one-fifth of Westerners supported that proposition.

State of the Rockies Conservation in the West Poll Environment vs. Jobs

Strong support for public lands

Regardless of political affiliation, the vast majority of Westerners believe that public lands support the economy and enhance the region’s quality of life, rather than “take land off the tax rolls, cost government to maintain them, and prevent opportunities for logging and oil and gas production that could provide jobs,” as shown in graphic below.
Conservation in West poll results

Diversity in state opinion on energy

Many of the questions in the past three years of polling have related to energy. When asked which energy sources they’d like to encourage, solar and wind power come out on top and coal is at the bottom. Of the fossil fuels, Westerners favor natural gas, even rating it above energy efficiency efforts. The results are similar when people are asked about what energy sources they’d like to discourage.

Colorado College State of the Rockies Conservation in the West Poll: Interest in Renewables

Regional views on energy

As we discuss in a previous post, the nation’s energy resources, both fossil and renewable, are not evenly distributed, so it’s no surprise that there are some significant differences among state residents when it comes to their energy preferences. The graphic below shows that in Arizona, Colorado, and New Mexico, majorities want to encourage solar, but support is lower in the other states and fell between 2012 and 2013 in Montana, Utah, and Wyoming

Colorado College State of the Rockies Poll Solar Energy

When asked about encouraging coal as an energy source, Wyoming stands out. No surprise there: it’s the largest coal-producing state in the country. There was also a large jump in support for coal from 2012 to 2013 in Wyoming, Montana, and Utah, but a decrease in support in Colorado. Perhaps the growing support for coal in some states is a backlash against increasing federal regulation of the fuel source.

Colorado College State of the Rockies Conservation in the West Poll Coal

Hopefully, the State of the Rockies project will continue to commission this poll so that we can keep tracking changes in Western public opinion in the years to come. If you find other surveys on Western environmental issues, please let us know.

Data sources

You can download data from the 2013 poll, a presentation summarizing the results, and state-level reports on this page. Results from 2011 and 2012 are also available.

Downloads

Thanks to Micah Day for assistance with this post.

EcoWest’s mission is to analyze, visualize, and share data on environmental trends in the North American West. Please subscribe to our RSS feed, opt-in for email updates, follow us on Twitter, or like us on Facebook.

The United States of Energy

Maps of our nation’s energy potential usually display just one source, such as the location of wind farms or the extent of natural gas fields. In an interesting new data visualization, advertising and PR firm Saxum has combined both fossil and renewable energy resources into a map of The United States of Energy.

Below are the front and back of the viz, which has so much info that it probably reads best in hard copy (click on images to enlarge).

The firm describes the project as “the first data visualization piece of its kind to comprehensively detail our nation’s vast and diverse energy portfolio. ” Here’s more from them:

What began as a simple graphic showcasing America’s energy riches quickly grew into a two-sided, folded map concept displaying thousands of individual data points. The #USofEnergy map visualizes our country’s energy potential by charting current sources of energy production and identifying future resources and known deposits. Energy resources surveyed include: natural gas, oil, coal, nuclear, hydroelectric, wind, geothermal, solar and biomass. We compiled the data from a broad range of industry and government sources, including the National Renewable Energy Laboratory, U.S. Geological Survey, U.S. Energy Information Administration, U.S. Army Corps of Engineers, Nuclear Research Council and American Wind Energy Association.

In some parts of the country, such as the nation’s midsection, there are so many different energy sources being exploited that the map is tough to make out. Overlapping layers present a difficulty here, but in other regions, such as the East Coast, there’s a lot of white space.

Saxum, which describes itself as “one of the leading integrated marketing communications agencies in the Great Plains,” highlights that 46 percent of U.S. energy is produced by nine states in the center of the country, as shown below.

United States of Energy Midwest
Source: Saxum

It’s worth zooming in to their legend to see what all these layers really mean. With biomass, for example, an entire county is shaded orange if it’s in the top-20 percent for producing energy in this way per square kilometer. With solar, only the best places in the country are shown. Here in Denver, for example, we’re not covered by the solar layer, but photovoltaic panels on the roof of my home/office generate the majority of electricity we consume (see this more detailed solar potential map from the U.S. Department of Energy).

Don’t ask me how, but it would be great to see an online, interactive version of Saxum’s map. That format could let you provide even greater detail on the energy sources, such as varying the size of the points used to display nuclear plants and hydroelectric dams by how much energy they produce, or by allowing users to turn layers on and off. (UPDATE: Saxum has an interactive data visualization here.)

Emily Guerin at High Country News has a good overview of the other trends that Saxum highlights in its map.

If you’re looking for maps of individual energy sources, check out our PowerPoint presentation on land use.

EcoWest’s mission is to analyze, visualize, and share data on environmental trends in the North American West. Please subscribe to our RSS feed, opt-in for email updates, follow us on Twitter, or like us on Facebook.