Category Archives: Endangered species

Hawaii, West and South have most at-risk species

The United States boasts the greatest diversity of ecosystems of any country and it’s home to more than 200,000 species. But about one-third of U.S. plants and animals are considered at risk by biologists, and at least 500 U.S. species are already extinct or missing.

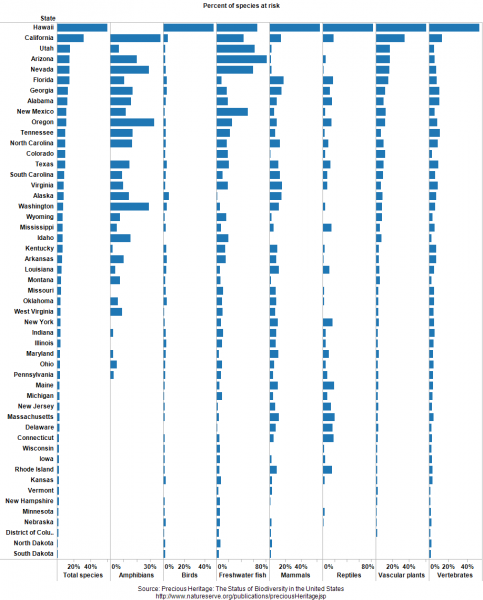
How do the 50 states compare in terms of number of species—and their imperilment? I’ve created some simple dashboards that illustrate the state-by-state tallies. These graphics, which you can sort, print, and customize, show the number of various types of species found in each state and the fraction of those species that are imperiled.

Percent of species at risk

The data comes from Precious Heritage: The Status of Biodiversity in the United States, a great book produced by The Nature Conservancy and NatureServe in 2000. At-risk species have elevated risks of extinction, according to the system developed by the project, and therefore have the greatest conservation concern.

Here are some of the patterns I noticed in the dashboards:

  • Despite their aridity, many Western states have tons of species. Arizona and New Mexico, neither of which have any coastal habitat, rank third and fourth in total number of species.
  • Hawaii has by far the greatest percent of species at risk. The native biodiversity of this isolated archipelago has been devastated by the introduction of non-native species.
  • States in the West, especially the Southwest, also have many imperiled species. California, Arizona, Utah, and Nevada round out the top 5 states.
  • Freshwater fish are doing very poorly, especially in the West, where Arizona, Utah, Nevada, New Mexico, California, and Oregon all have at least 25 percent at risk.
  • Outside of Hawaii, birds tend to be doing better than many other types of species.

Using the dashboard

A couple of notes about the dashboards:

  • You can sort by state name or by any of the variables at the bottom.
  • Because Hawaii is such an outlier, I can be helpful to examine the dashboard by excluding that state (just click on the name and the option will pop up).
  • The toolbar at the bottom allows you to create an image or PDF, plus download the underlying data.
  • This dashboard reports the percent of a state’s species at risk, not the actual number, but that data is also provided in Precious Heritage.

Learn more in our biodiversity deck

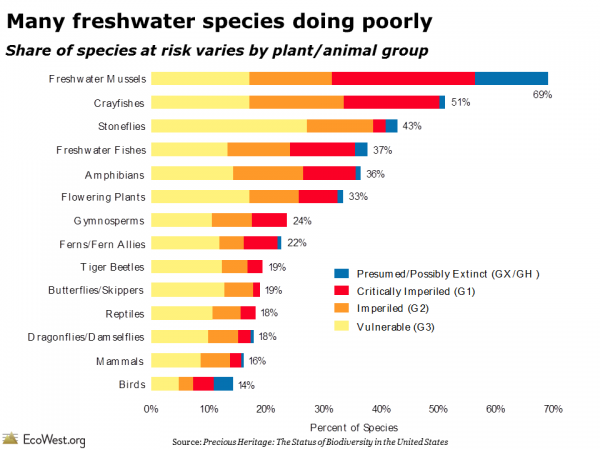
These dashboards focus on the state level, but in our biodiversity slide deck we offer a slew of maps and graphics summarizing the national picture. The one below shows that many freshwater species are in jeopardy, whereas some of the best known types of species, such as birds and mammals, are doing comparatively better.

National species at risk

Data sources

Anyone doing research on U.S biodiversity should definitely check out the Precious Heritage book. It contains a wealth of information on the status of U.S. species and many of the graphics in the book are available for free download on this page.

EcoWest’s mission is to analyze, visualize, and share data on environmental trends in the North American West. Please subscribe to our RSS feed, opt-in for email updates, follow us on Twitter, or like us on Facebook.
Trends in endangered species listings

To list or not to list?

That’s the key question facing the U.S. Fish and Wildlife Service when it comes to endangered species.  More than 1,300 plants and animals have been granted federal protection and these so-called listed species are embroiled in practically every Western environmental issue. The Endangered Species Act (ESA) has real teeth and it’s often the biggest hammer in environmentalists’ toolbox.

In this set of slides, I show where federally protected species live and review the history of ESA listings.

Trends in endangered species listings from EcoWest on Vimeo.

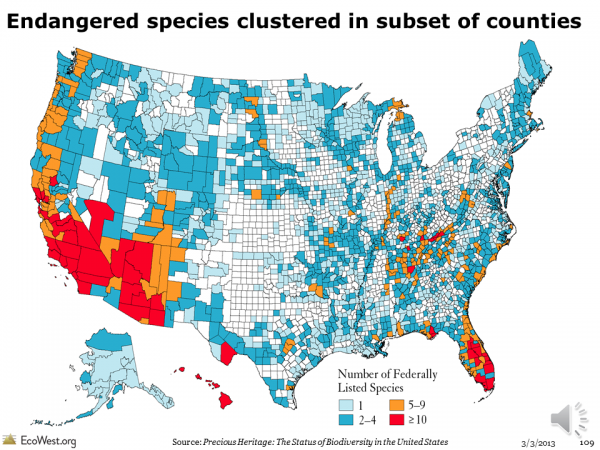
Endangered species are found throughout the country, but they tend to be concentrated in a few hotspots. The graphic below, from NatureServe, depicts how many listed threatened and endangered species are found in each county. Hawaii, the Pacific Coast, the Southwest, Appalachia, and Florida stand out for their large number of listed species, but many U.S. counties, especially in the Midwest, have no threatened or endangered species.

Species map

The number of listed species might seem like a useful barometer for tracking the status of biodiversity, but it’s an imperfect metric at best. Species are supposed to be added to the list solely on the basis of science and biologists’ assessment of their imperilment, even if doing so would derail development or impose steep economic costs. In reality, several studies have found that politics frequently intrudes in the listing process. See, for example, my book Endangered: Biodiversity on the Brink, and a 1990 book by Richard Tobin (no relation),  The Expendable Future: U.S. Politics and the Protection of Biological Diversity.

In its first term, the Obama administration has listed more species per year than George W. Bush’s administration, but considerably fewer than during the Clinton administration. Looking at the rate of species listings says as much about the political appetite for such regulatory moves as it does about the status of the nation’s biodiversity.

The ESA gives citizens the ability to petition the federal government to add a new species to the list and some environmental groups, such as the Center for Biological Diversity and WildEarth Guardians, frequently make these requests. Fish and Wildlife is obligated to evaluate these petitions and decide whether a species should be listed, but with limited resources the agency can only process so many petitions. ESA opponents in Congress and elsewhere have figured out that by limiting this listing budget, they can constrict the pipeline of new species gaining federal protection.

Candidates in regulatory purgatory

The result is a gaping loophole that allows the government to declare a species’ listing as biologically “warranted but precluded” by budget constraints. Fish and Wildlife is only supposed to use this exception if “expeditious progress is being made to add qualified species” to the endangered club. In reality, the exception has become an all-too-convenient way for the government to abdicate its responsibilities under the ESA. I liken it to creating a long, slow-moving line for species to get aboard our legislative Noah’s Ark.

At least 24 species have blinked out while in the listing pipeline and the backlog of candidate species was the subject of recent litigation.  The Obama administration has made some progress in reducing the number of candidates from about 250 at the start of his first term to 192 in November 2012. Candidate species, like listed species, are found throughout the country, but they’re concentrated in Western and Southern states.

The number of listed species is bound to keep rising because only 20 have been declared recovered and no longer in need of ESA protection. In 18 cases, the government decided the original listing was in error, often because of taxonomic changes or the discovery of new populations. A species protected by the ESA has been declared extinct only nine times over the past four decades, which is pretty impressive given that many plants and animals only receive ESA protection after they’ve been driven to the brink.

Downloads

Data sources

Fish and Wildlife’s ESA site is the go-to source for information on endangered species. I’ve also found Precious Heritage: The Status of Biodiversity in the United States to be an extremely helpful resource. The Nature Conservancy and NatureServe make some of the book’s figures available here.

If you’d like to explore some of this data further, I’ve built a state-by-state dashboard that shows the number of listed, candidate, and extinct species.

EcoWest’s mission is to analyze, visualize, and share data on environmental trends in the North American West. Please subscribe to our RSS feed, opt-in for email updates, or follow us on Twitter.