
If you want to visualize your favorite wilderness area or map the protected areas in your city, LandScope America provides a free and convenient resource. This user-friendly GIS tool, a collaborative project of NatureServe and the National Geographic Society, lets you explore protected lands across the country, create maps of conservation projects, and share your work with others.

Key features of LandScope America
The focal point of LandScope America is an interactive map that overlays data layers, photos, and user-contributed stories. The map includes three key elements:
- Base maps: three options (street, satellite, or hybrid) are found at the upper-right corner.
- Themes: these comprise the spatial data that overlay the base map. Options include conservation priorities, protected areas, threats, plants and animals, and ecosystems. Users can change the theme by selecting the drop-down menu in the upper-left corner.
- Thematic layers: these options allow users to mix and match different data sets within a theme. For instance, the map below shows protected areas, featuring layers from the National Conservation Easement Database and Protected Areas Database of the U.S.
Diverse range of target audiences
One of the key advantages of LandScope America is its versatility for different user groups. Audiences that can benefit from the resource include:
- Public agencies: In a recent post, we noted that $39 billion is spent annually on conservation in the United States. Public agencies could increase their effectiveness by combining the conservation priorities of public and private organizations in a single map layer. For example, agencies might overlay The Nature Conservancy’s ecoregional priorities with State Wildlife Action Plans and regional greenprints to better understand the level of coordination between various groups.
- Land trusts: Using the mapping platform, land trusts can create, share, and print maps of conservation projects. For organizations on a tight budget, LandScope America can provide a powerful alternative to expensive GIS packages.
- Private landowners: For farmers, ranchers, and private timberland owners, LandScope America features useful resources on options and financial incentives for conserving land. Using the map, landowners can see how their property fits into the wider ecological context and learn how providing wildlife habitat can make them eligible for incentive programs such as the Forest Land Enhancement Program.
Mapping in practice
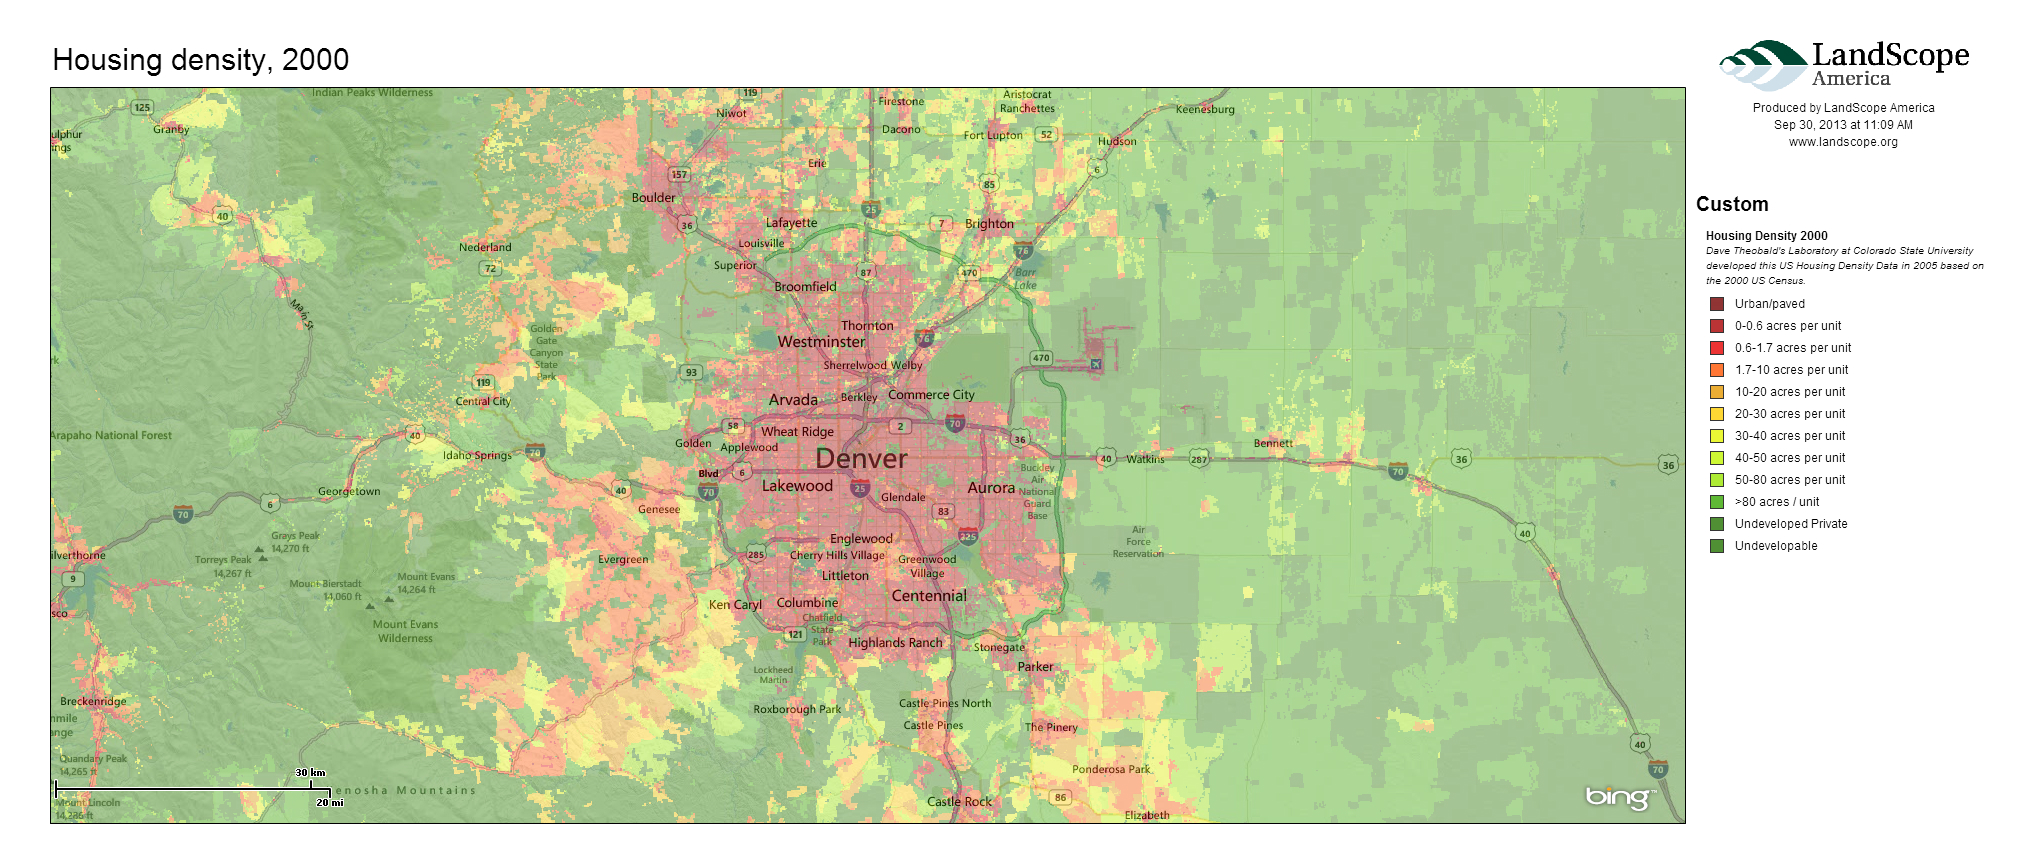
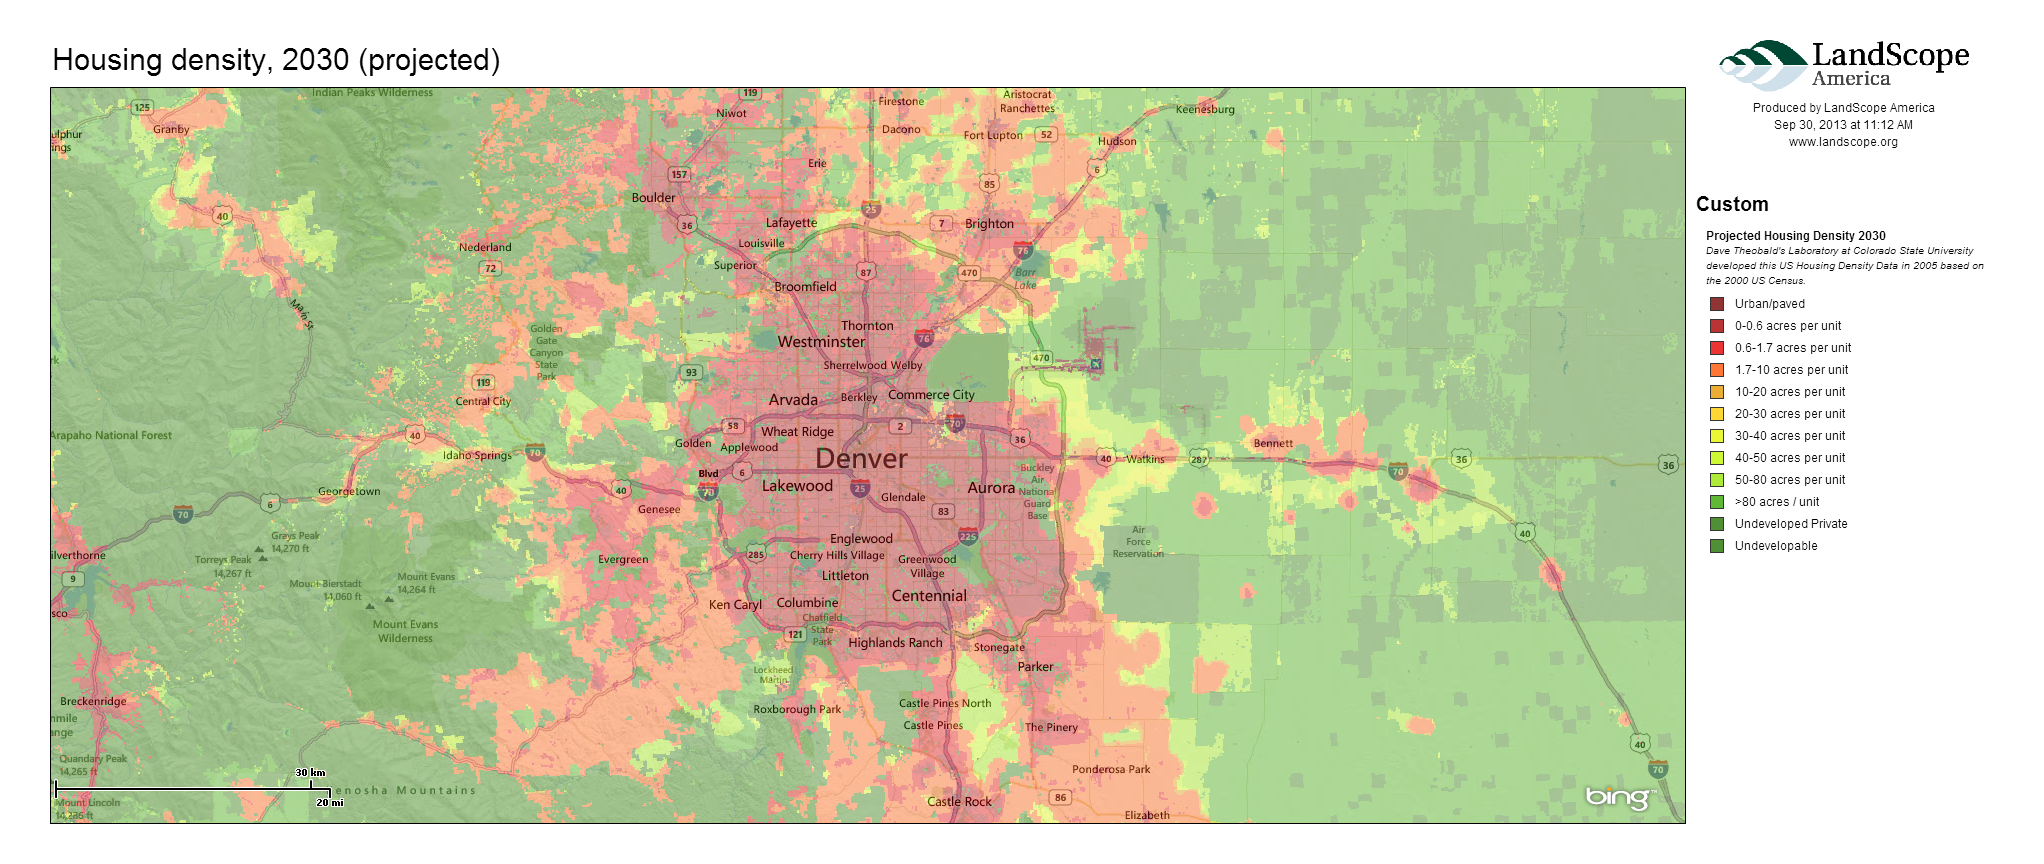
As an example, I mapped how changes in housing density around Denver relate to key wildlife habitat. The following three maps show the rapid rate of projected growth emanating from the city’s center.

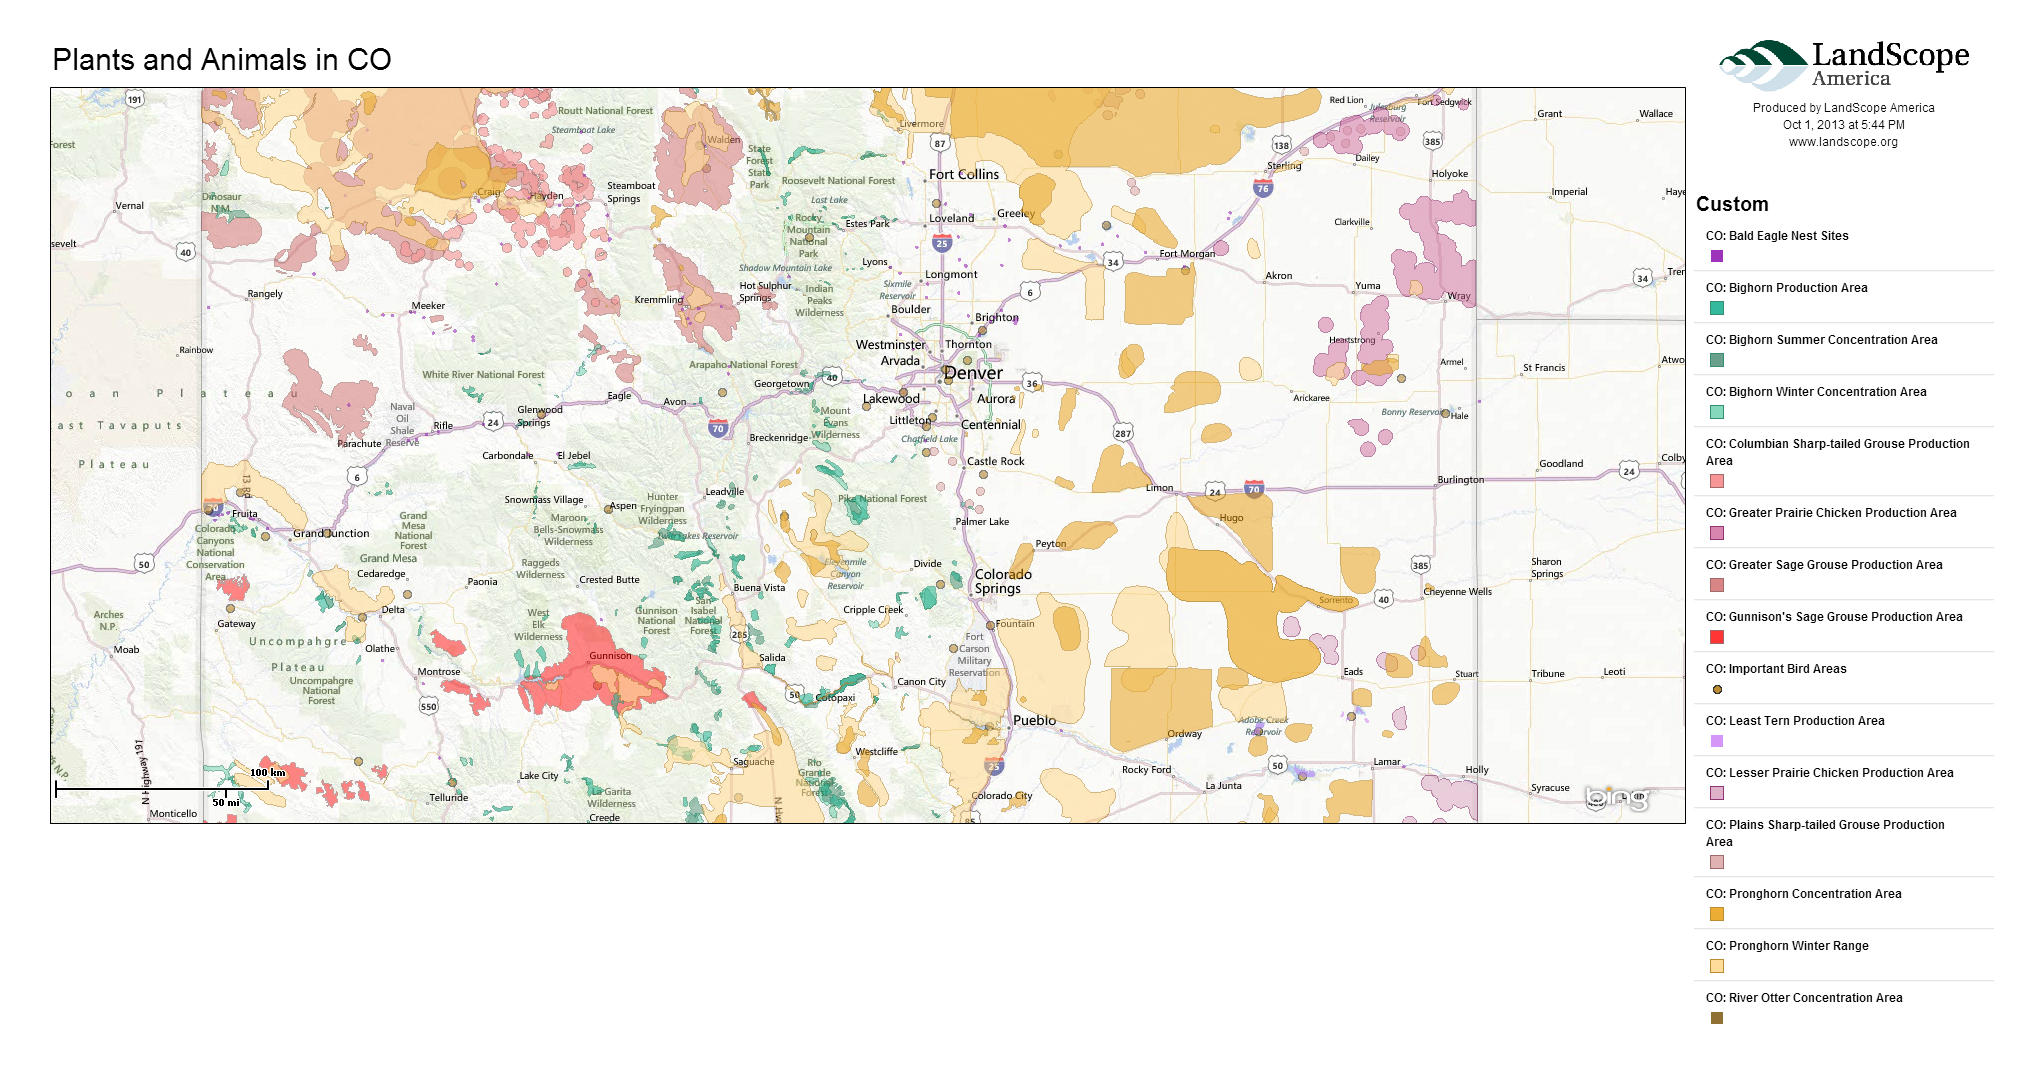
The next map shows important nesting areas and wildlife habitat in Colorado. Land trusts and public agencies could use similar maps to understand how projected human development may encroach upon habitat.
Public expenditures in conservation
I also experimented with the map’s “Conservation by the Numbers” scorecards to examine trends in conservation spending across the West. This data is drawn from the Trust for Public Land’s Conservation Almanac, which tracks acres protected and dollars spent using public funding to buy land for parks and open space, during the time period 1998-2005.
Examining total spending on conservation, we see that California is the largest aggregate spender, with an annual average of $363 million spent on parks and open space protection. Wyoming has the lowest public expenditures, with $2.2 million spent annually on conservation funding. Montana has highest per capita public investments in conservation—roughly $179 per person. On the other end, Nevada spends only $13 per person on conservation. Below is an image from a dashboard we created to visualize the data.
 A wide variety of factors, however, influence the cost of protecting land in a given state. In Washington, it costs an average of $2,044 to conserve an acre of land, but only $14 per acre conserved in Idaho. Several variables could explain this wide gap, including differences in land prices and development pressures. Washington’s high costs may also reflect some high-value acquisitions during the period in question.
Explore beyond your backyard, both near and far
LandScope America also lets you discover and explore open spaces near your own home. Just enter a zip code to find parks and nature preserves, as well as the names of conservation organizations working in the area.
In addition, LandScope America exposes users to more remote wilderness areas through photographs, audio, video, and articles embedded directly in the maps.
Explore your favorite places in the West using LandScope America, and let us know what you learn.
Downloads
- Download Slides: Landscope America (3944 downloads )
- Download Notes: Landscope America (4878 downloads )
- Download Data: Landscope America (3828 downloads )
EcoWest’s mission is to analyze, visualize, and share data on environmental trends in the North American West. Please subscribe to our RSS feed, opt-in for email updates, follow us on Twitter, or like us on Facebook.

