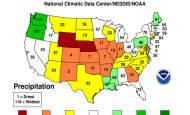
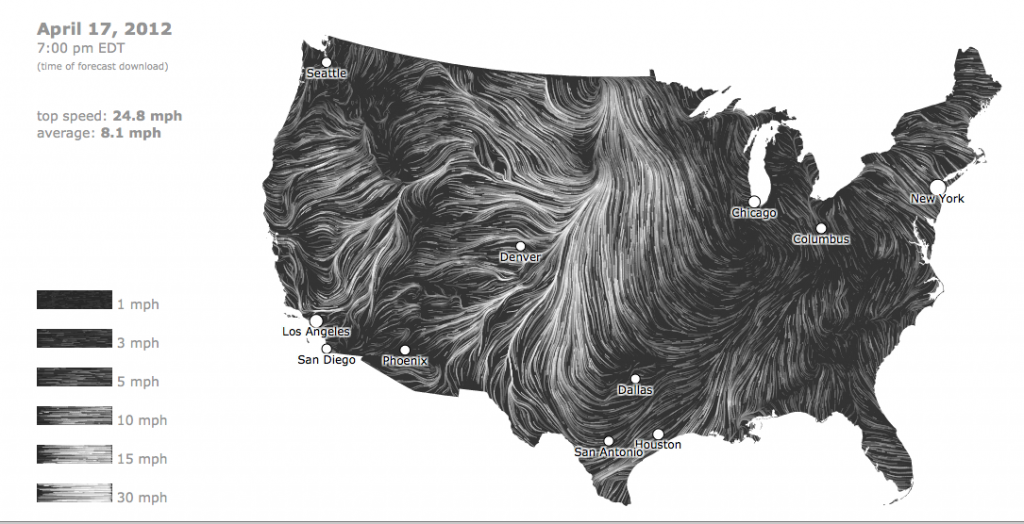
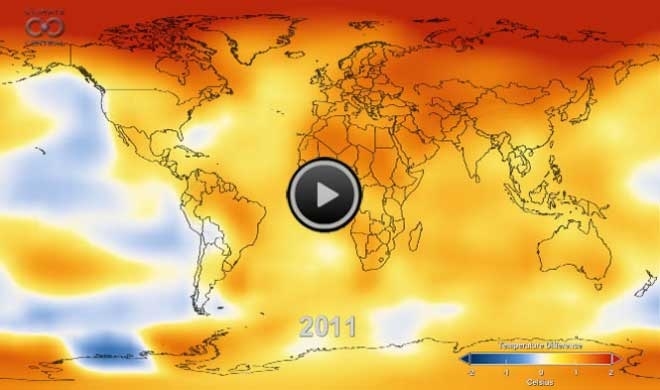
No doubt about it: 2012 was toasty. Today, the National Oceanic and Atmospheric Administration reported that 2012 was not only the warmest on record for the lower 48 since 1895 but also the second worst on a measure known as the Climate Extremes Index, which includes factors such as temperature anomalies, drought patterns, and the strength of tropical storms (you can create your own visualizations of the index here).
I’ve put together some of the summary graphics from the report and related media coverage in this slide deck.
2012 was hottest year on record in U.S. from EcoWest on Vimeo.
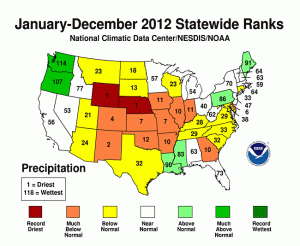
It was definitely an abnormal weather year for the American West (when was the last year that felt “normal”!?). Wyoming, Utah, and New Mexico all had their hottest years on record, while 2012 ranked second warmest for Colorado and Nevada. The story for precipitation was more varied, with many inland states suffering a deep drought as Oregon and Washington experienced some of their wettest years since the late 19th century.
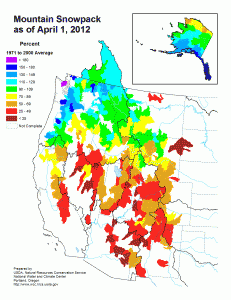
Nationwide, the extent of snow cover was the third smallest since 1966/1967. In the West, areas outside of the Northern Rockies and Pacific Northwest had a meager snowpack by April 1, 2012.
It’ll be interesting to see if this stark summary of extreme weather in the United States gains any traction in the national conversation. This report is currently the top story on the websites of the New York Times and Washington Post.
For more on the effects of rising temperatures in the American West, check out our climate deck.
Downloads
- Download slides: 2012 State of the Climate (3680 downloads )
- Download notes: 2012 State of the Climate (4569 downloads )
EcoWest’s mission is to analyze, visualize, and share data on environmental trends in the North American West. Please subscribe to our RSS feed, opt-in for email updates, follow us on Twitter, or like us on Facebook.
