Category Archives: Data visualization

Sightsmap plots most photographed places on planet

Governments around the world protect places for a variety of reasons. There are landscapes set aside for critters and memorials to fallen warriors. In the United States and elsewhere, one of the biggest motivations for creating national parks and other preserves is that they’re pretty to look at and photograph.

Beauty may be in the eye of the beholder, but aesthetics and scenic vistas also figure prominently in things like environmental impact statements. Is there a way to quantify how photogenic or beautiful a spot is?

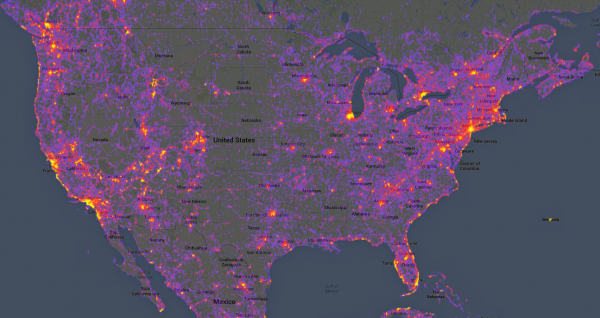
Sightsmap is the closest thing I’ve found. Using data from photos uploaded and geotagged in Panoramio, a popular photo sharing service acquired by Google in 2007, Sightsmap generates high-resolution heat maps that illustrate the number of photos snapped at sites around the world. Below are global and U.S. maps (click to enlarge, and see this gallery for more maps).
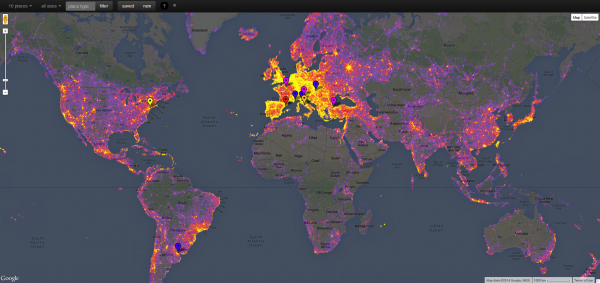
Sightsmap World
World
Sightsmap United States
United States

Panoramio already has more than 100,000,000 images, but its photos represent just a tiny fraction of the millions of images captured every day on Earth. Data from Panoramio’s sample isn’t representative. Among other biases, the service appears particularly popular in Europe, and there are data quality issues I note below. Despite these limitations, Sightsmap tells some interesting stories about how we travel and photograph the world around us.

Some popular unpopulated places

As you would expect, more populated places tend to have more photographs on Sightsmap, but there are plenty of hotspots in unpopulated parts of the American West (and other regions). The map below shows that Southern Utah, one of the least populated places in the continental United States, is also one of the most photographed because it’s home to so many national parks and tourist attractions.
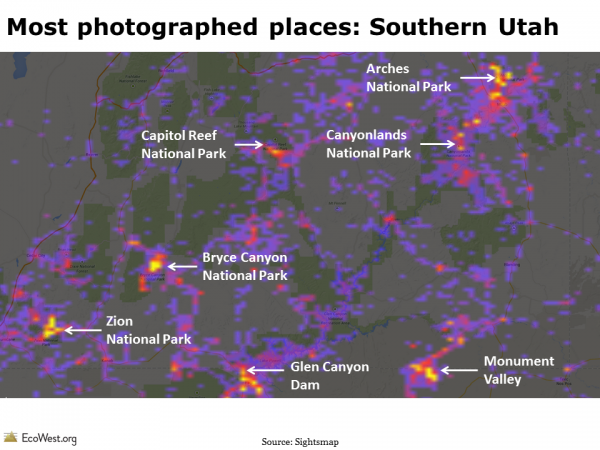
Most photographed places Southern UtahSightsmap allows you to drill down and show the density of photographs at a very high resolution. Once you’re zoomed in close enough, you can also see thumbnails of the images. Below is the heat map for the area around Delicate Arch, in Arches National Park, plus a photo of me in that spot.
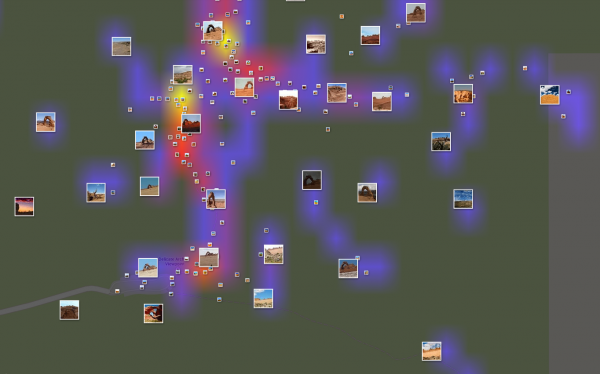
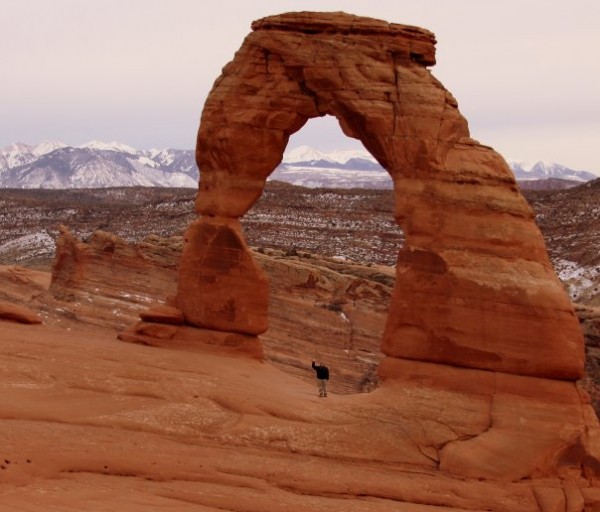
Sightsmap Delicate Arch, Utah
Delicate Arch, Utah


Delicate Arch, Utah.
The author at work. Delicate Arch, Utah.

National parks: most visitors stick to roads

Look at the photo heat maps for national parks and you’ll see a pattern familiar to any ranger or frequent visitor: people tend to stick to the roads and pavement. Below is the Sightsmap for Yellowstone National Park.
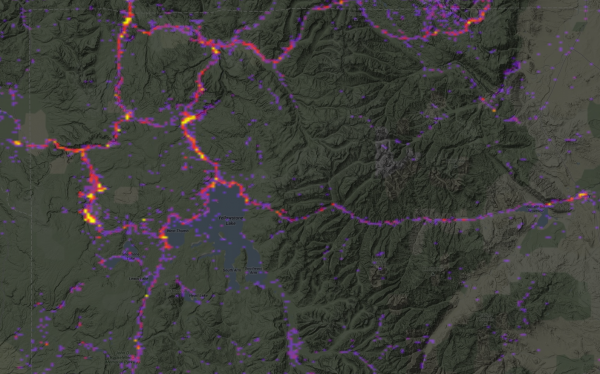
Sightsmap Yellowstone
Yellowstone National Park

Tourists and photographers also tend to concentrate in just a few parts of Western states and cities. Below is a map of the state of Wyoming. Virtually all of the activity on Sightsmap is focused in the northwest portion of the state, home to Yellowstone and Grand Teton national parks. Other hotspots are the Wind River Range and the Bighorn Mountains (where I photographed the sunset that appears in the EcoWest banner).
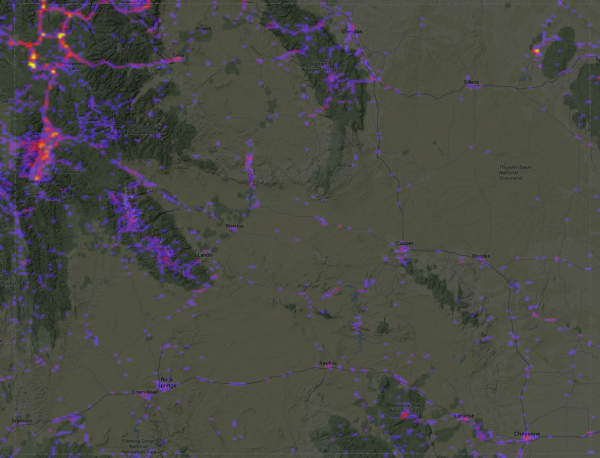
Sightsmap Wyoming
Wyoming

Even in a tourist mecca like the San Francisco Bay Area, where I suspect there are plenty of residents geotagging/uploading their photos, the heat maps show that certain areas are much more photogenic than others. A closeup of the 49-square-mile city of San Francisco reveals hotspots around sites such as the Golden Gate Bridge and Transamerica Pyramid, plus a fair number of shots taken on San Francisco Bay, but relatively few photos in the city’s western neighborhoods.
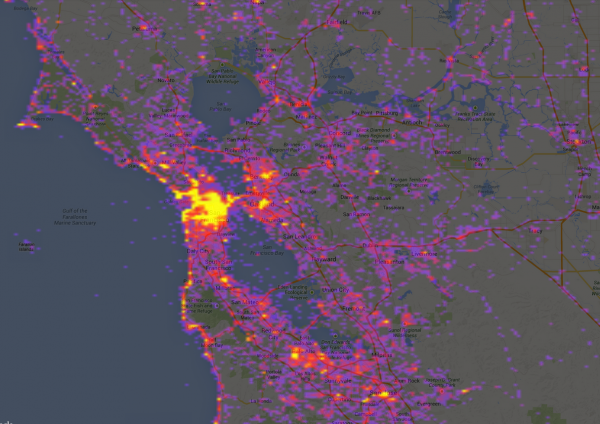
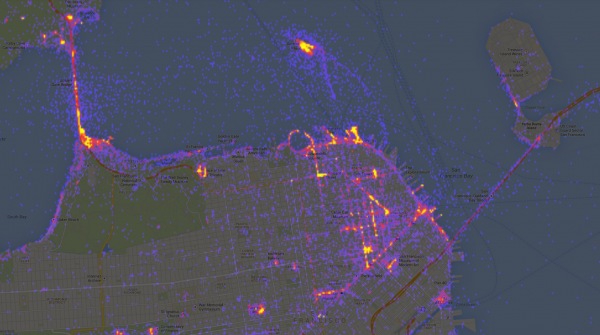
Sightsmap Bay Area
San Francisco Bay Area
Sightsmap SF
San Francisco

Restricted access: blank spots on the map

When I created human footprint maps, I was especially interested in the blank spaces where impacts were minimal. Likewise, I was instantly drawn to areas on Sightsmap where few or no photographs had been posted.

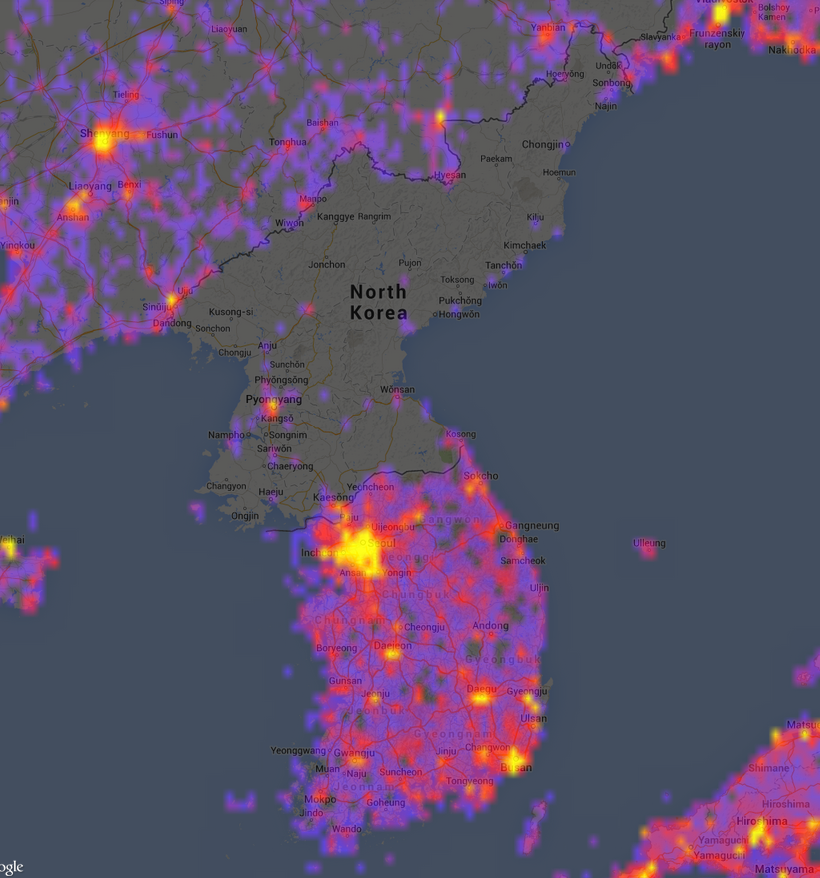
Below are two maps of the Korean Peninsula: I created the first using Sightsmap; the second was snapped by an astronaut aboard the International Space Station.
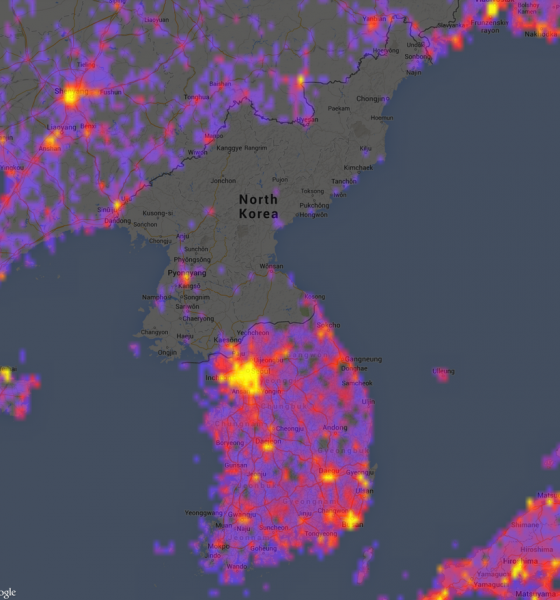
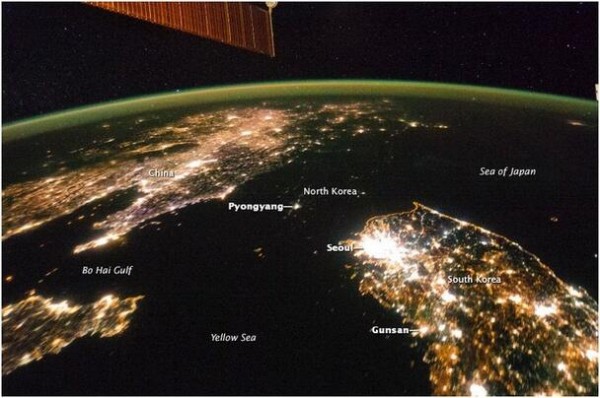
Sightsmap Korea
Photo heat map of Korean Peninsula

Night lights on the Korean Peninsula. Source: NASA/ISS

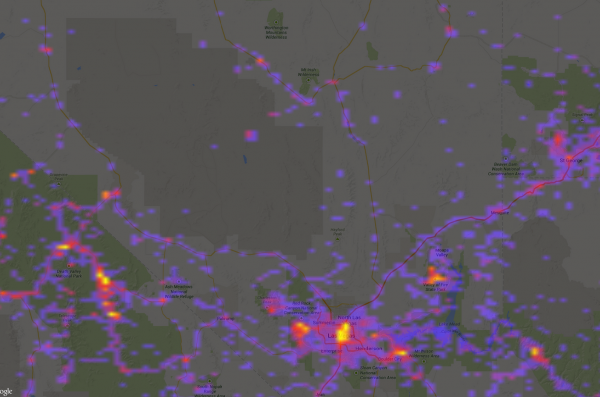
It’s easy to pick on North Korea, but we also have plenty of places in our own country where public access is prohibited. Below is a Sightsmap view of the area around Las Vegas, which includes a number of military installations to the northwest of the city that are annotated in the second map.
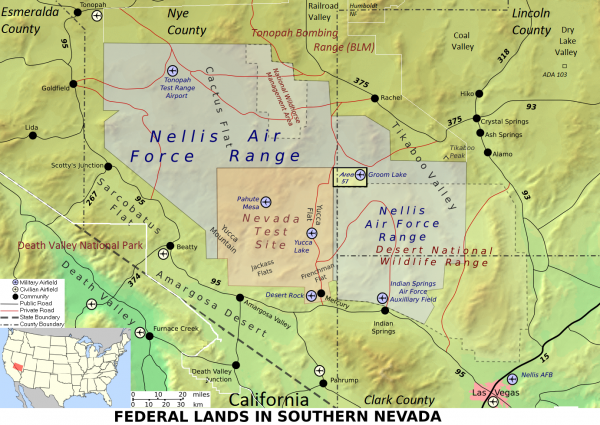
Sightsmap Las Vegas

Source: Wikipedia
Source: Wikipedia

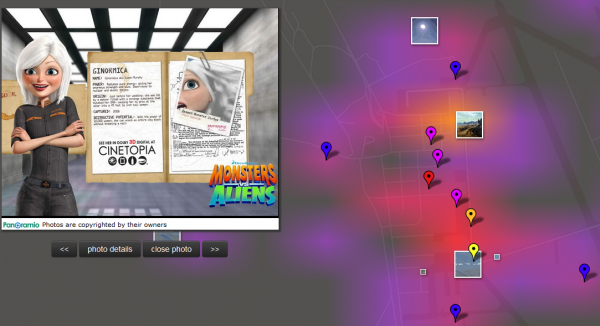
I was curious if there were photos of the fabled Area 51, the military installation that is ground zero for UFO folklore and assorted conspiracy theories. Sightsmap shows some grainy images of the facility that legitimately look like they were captured by photographers zooming in from surrounding mountains, plus some photos that appear to be from a tour. But there’s also this garbage image below, which someone uploaded and geotagged at Area 51, so Sightsmap surely has some questionable data.

Area 51 Sightsmap

Like any crowdsourced endeavor, Sightsmap is only as good as the data that users share and tag. Despite its flaws, I found these heat maps fascinating to explore. I could imagine them being useful not only to photographers who are plotting where to set up their tripods, but also to city planners and land managers trying to understand patterns in visitor use.

Data sources

Here’s a description from Sightsmap:

The heatmap shows the places people like, based on the number of panoramio photos at each place in the world. The dark areas have few photos, the red areas have more and the yellow areas have a large number of photos geotagged. The hottest places have markers linking photos, Streetview, Wikipedia, Wikivoyage, Foursquare and Google Plus articles about the site. The place names are selected by the Wikipedia readership numbers and foursquare checkins. Area populations are based on the geonames database. Street level heatmaps are available for [the] top 15,000 places in the world, sorted by the number of photos in an area of a size of a few square kilometers around the place center. The popularity ranking of places in high-res area maps is computed by combining place hotness with popularity rankings from Wikipedia, Foursquare and real-time Google Places selection.

EcoWest’s mission is to analyze, visualize, and share data on environmental trends in the North American West. Please subscribe to our RSS feed, opt-in for email updates, follow us on Twitter, or like us on Facebook.
Deep brain freeze: visualizing the polar vortex

For the second afternoon in a row, a potent cold front has swept across Denver, marking the return of a deep freeze for much of the country. Yesterday, my weather station recorded a 32-degree drop in less than 90 minutes (here’s a chart).

This latest cold snap is sure to revive talk about the polar vortex, a persistent upper-level cyclone that swirls high above the Arctic and Antarctica, so I thought I’d round up some visualizations that illustrate what’s happening.

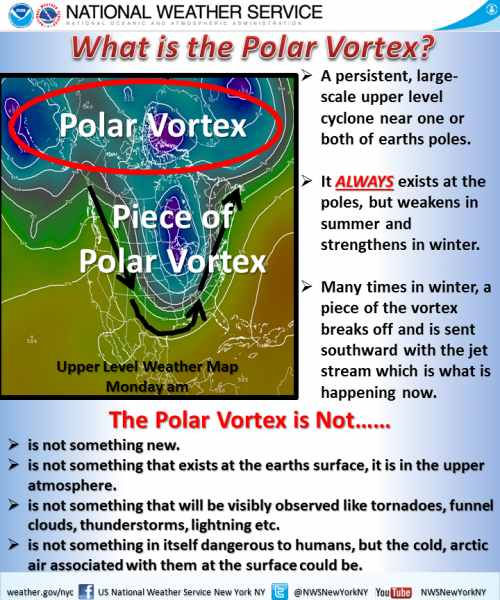
The graphic below, from the National Weather Service, explains what the polar vortex is, and isn’t.

NWS polar vortex graphic

The polar vortex always remains above the poles, but sometimes the Arctic vortex weakens and allows some frigid air to move south into the United States. (CNN has a good piece explaining why the polar vortex is something of a misnomer for describing the weather we’re experiencing in the states.)

NASA has also produced a great little video describing how the polar vortex works:


Here’s a graphic from the CBC up in Canada, where they have even more experience with the polar vortex.

CBC polar vortex graphic


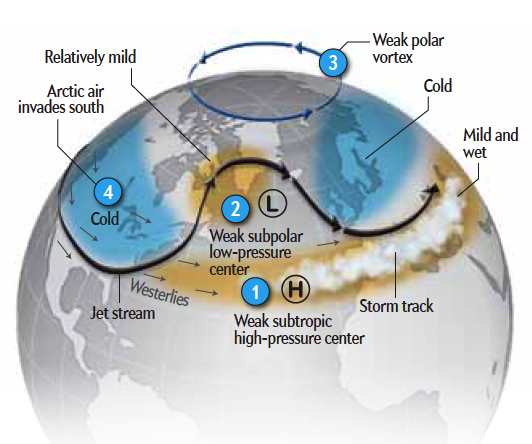
I also found the graphic below from Scientific American to be helpful in understanding the concept.

vortex-graphic


Although the polar vortex has been portrayed by some as disproving global warming, there is actually evidence that climate change is playing some role in the cold air descending south. The thinking is that warming in the Arctic is messing with the vortex and associated jet stream. Brian Walsh has a nice summary in Time and Eric Holthaus has a good explainer at Quartz.

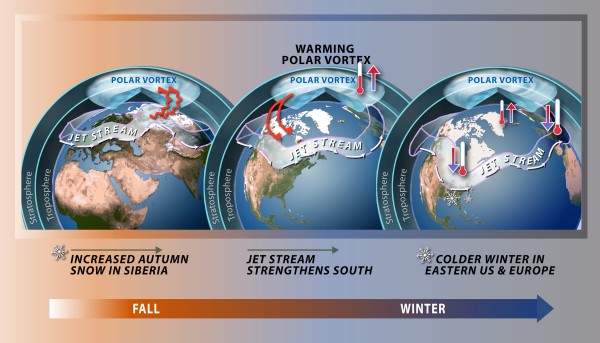
There’s also some research linking heavy autumn snows in Siberia to the polar vortex and abnormally cold weather in the Eastern United States and Europe, according to an NSF-funded study.

Source: Nicolle Rager Fuller, National Science Foundation

Here’s how NSF describes the graphic above:

Researchers have validated a new weather prediction model that uses autumn snowfall to predict winter cold in the United States and Europe. When snowfall is high in Siberia, the resultant cold air enhances atmospheric disturbances, which propagate into the upper level of the atmosphere, or stratosphere, warming the polar vortex. When the polar vortex warms, the jet stream is pushed south leading to colder winters across the eastern United States and Europe. Conversely, under these conditions the Arctic will have a warmer than average winter.

It’s amazing how the snowpack in Siberia can affect the temperature in New York, and it almost sounds like an example of the butterfly effect, the notion coined by chaos theory pioneer Edward Lorenz that small perturbations in a system can theoretically have large effects down the line (e.g., a butterfly flapping its wings causing a hurricane halfway around the globe).

Just as fascinating to me is how the term “polar vortex” has roared onto the scene this winter like an Arctic cold front sweeping down the High Plains. I’m something of a weather nerd, but I hadn’t heard much about the polar vortex before it caught hold during the January cold snap.

But this is not some newfangled scientific concept. The term was used as early as 1853, and the apparent trigger for the cold wave in early 2014, a phenomenon called sudden stratospheric warming, was discovered in 1952. Rush Limbaugh claimed that the polar vortex was a “hoax” created by the liberal media. NBC weatherman Al Roker set the record straight with a tweet:

I’d love to see an analysis of how this term took hold and was used/misused as a case study in science communications and journalism. The word “vortex” has a certain mystical quality; for me, it instantly conjures Sedona, where supposed vortices of spiritual energy are located among the red rock formations. If you ask Google to define vortex, the second definition, after the physics stuff, is “something regarded as a whirling mass” with the example of “the vortex of existence.” So perhaps vortex captures the American zeitgeist.

According to Wikipedia, the polar vortex is also known both as the “polar low,” which sounds to me like a term a psychiatrist would use to describe a depressed patient, and “circumpolar whirl,” which makes me think of a dance step or frosted decoration on a cake. I wouldn’t expect to see “polar low” or “circumpolar whirl” getting as much ink or scrolling on cable news.

Whatever the reason, the polar vortex has entered the American consciousness, and the exceptionally cold temperatures in some of the country for a portion of the winter have become part of the whole climate change narrative. It takes some mental jujitsu to yield to the counter-intuitive notion that global warming can actually cause cold waves to plunge deeper and increase the frequency of epic snow storms while also threatening the snowpack overall.

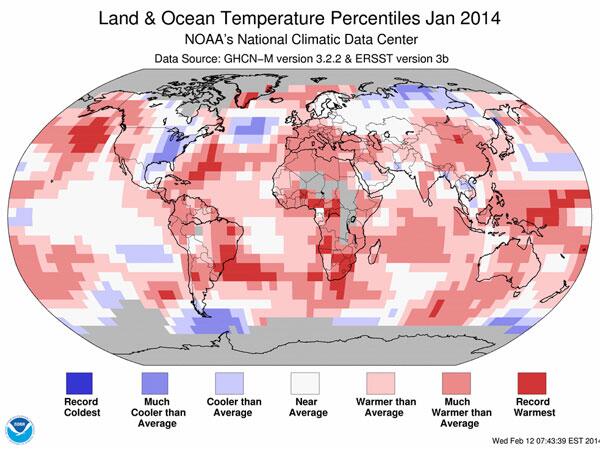
For all the talk of Arctic air masses in the states, January was the fourth-warmest year on record for the globe, as shown in the NOAA map below, so it’s important to remember that a piece of the polar vortex is influencing a temporary weather pattern on just one portion of the planet.
Bg7evj2CUAAGjfL.jpg large

EcoWest’s mission is to analyze, visualize, and share data on environmental trends in the North American West. Please subscribe to our RSS feed, opt-in for email updates, follow us on Twitter, or like us on Facebook.
Trulia’s mapping tool goes far beyond real estate

You may quibble with how Trulia values your home, but the real estate website provides an impressive interactive map with detailed views of social and environmental variables.

In addition to offering a treasure trove of information on real estate down to the parcel level, Trulia’s mapping engine also visualizes high-resolution data on things like commute times and the risk of wildfires, flooding, and earthquakes.

Below I describe some of my favorite features and share some screenshots. This mapping tool is not without its issues, but it’s generally well-designed and easy to use.

Commute times: driving and transit

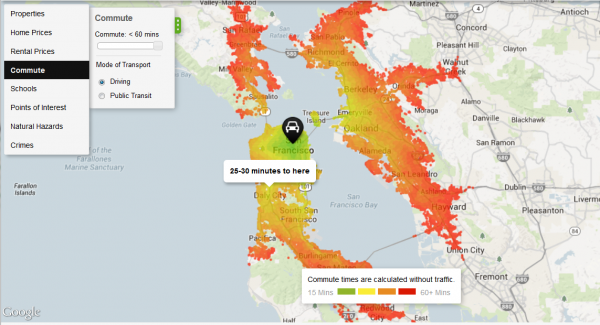
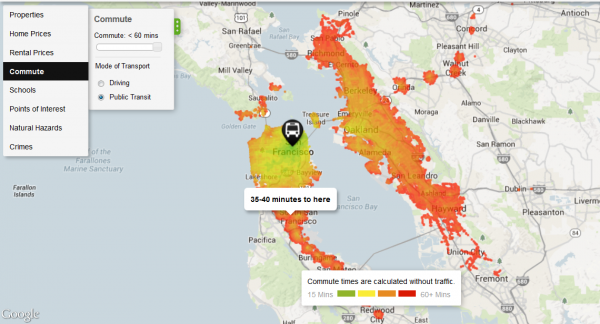
One of Trulia’s most interesting features is a layer that maps commuting times. Below are the heat maps for San Francisco, first for driving and then for transit. The two maps are pretty close. Putting aside transit strikes, the Bay Area has a solid system of trains, buses, ferries, and other alternatives to driving, so commuting long distances by transit is feasible, even mandatory, for many residents in the region. These maps don’t account for traffic delays, which is a big caveat. Click on images to enlarge.

San Francisco commute time driving
Source: Trulia
San Francisco commute time transit
Source: Trulia

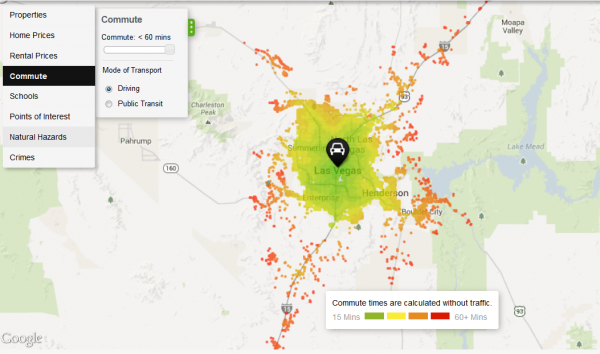
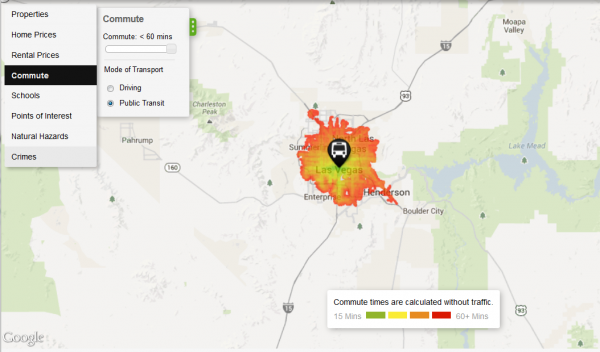
Compare the pair of images above to the ones below for Las Vegas, where there’s a huge disparity between driving and public transit commuting times. If you give yourself an hour to commute to the city center, being able to drive opens up many more places to live around Las Vegas.

Las Vegas commute driving
Source: Trulia
Las Vegas commute transit
Source: Trulia

Natural hazards mapped

Another useful aspect of Trulia’s map is a collection of natural hazard maps, including depictions of the risks of flooding, wildfires, tornadoes, earthquakes, and hurricanes. One criticism is that the mapping engine doesn’t let you export your views, so you’ll have to rely on screenshots. It’s also difficult to zoom out and see the entire country. You can get around this by zooming out on your browser (press control and the minus sign), which is what I’ve done for the national maps below, but then the text is microscopic. Trulia works best when zoomed in to a region or metro area.

Wildfires

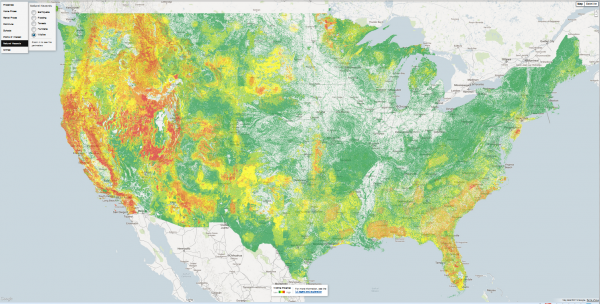
The map below shows wildfire potential across the country and illustrates the inherent risk of an area experiencing a severe blaze under the right conditions.

Trulia wildfire
Source: Trulia

Trulia does a good job explaining its data sources. For the wildland fire potential (WFP) layer, here’s the definition they’re using:

Areas with high WFP values represent fuels with a higher probability of experiencing a high-intensity fire under conducive weather conditions. Areas with low WFP values, therefore, represent a low probability of experiencing a wildfire. The WFP map is maintained by the USDA Forest Service, Fire Modeling Institute, and is intended to be used in analyses of wildfire risk at regional or national scales. The WFP is not intended to be a forecast or wildfire outlook, as it does not include information on current or forecasted weather or fuel moisture conditions.

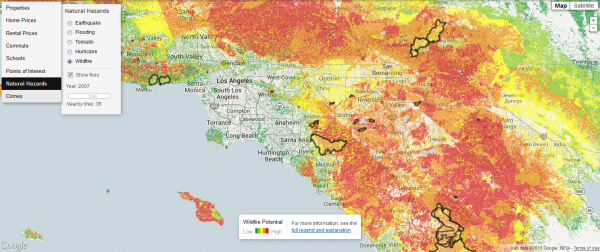
If you zoom in close enough, the wildfire data also includes perimeters of previous fires. Below is the fire potential around Los Angeles, including the outlines of fires during 2007, a particularly active year. At least in this part of the country, extremely high fire danger areas lie in close proximity to places where the risk is virtually nil.

Trulia wildfire LA
Source: Trulia

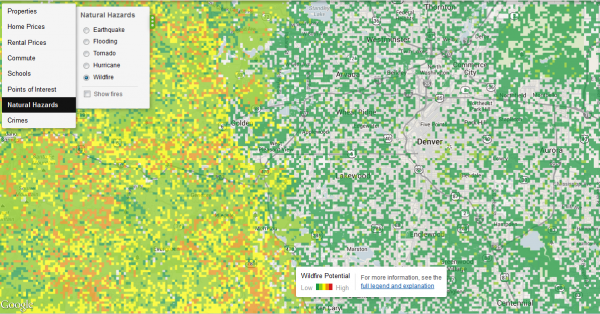
If you zoom in to some other regions, the data may get a little funky. Below is a close-up of the Denver area. In the city, the pixelated data suggests that some city blocks have a greater wildfire risk than others, but in reality you’re not going to see a wildfire within the Denver city limits. The map is basically right: as you move west, into the foothills of the Front Range, wildfire potential definitely increases, but at this resolution the map is somewhat misleading.

Trulia wildfire Denver
Source: Trulia

Flooding

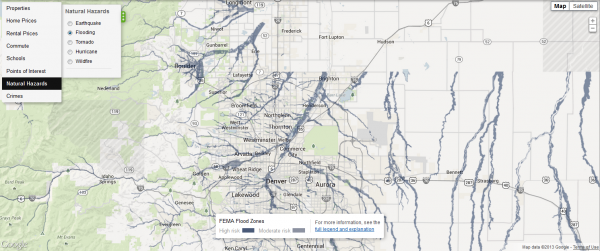
Another limitation is that Trulia is missing data for some parts of the country. In the screenshot below, flood risks suddenly disappear north of Denver. That’s because there’s no data for Weld County. Trulia cautions that even counties with flood data from FEMA don’t necessarily have full coverage.

Trulia flood Boulder
Source: Trulia

Here’s how Trulia describes the high (100-year flood zone ) and moderate (500-year flood zone) risk categories:

In high risk areas, there is at least a 1 in 4 chance of flooding during a 30-year mortgage. All home and business owners in these areas with mortgages from federally regulated or insured lenders are required to buy flood insurance. In moderate risk areas, the risk of being flooded is reduced but not completely removed. These areas submit over 20% of NFIP claims and receive one-third of disaster assistance for flooding. Flood insurance isn’t federally required in moderate-to-low areas, but it is recommended for all property owners and renters.

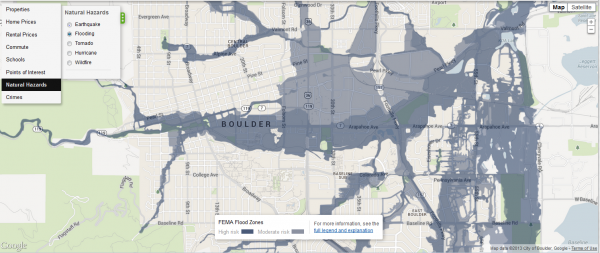
Although Trulia’s flood risk data may be spotty, covered areas are mapped in great detail, as shown in the map below of Boulder, Colorado, which recently experienced epic flooding.

Trulia flood Boulder zoom
Source: Trulia

Tornadoes

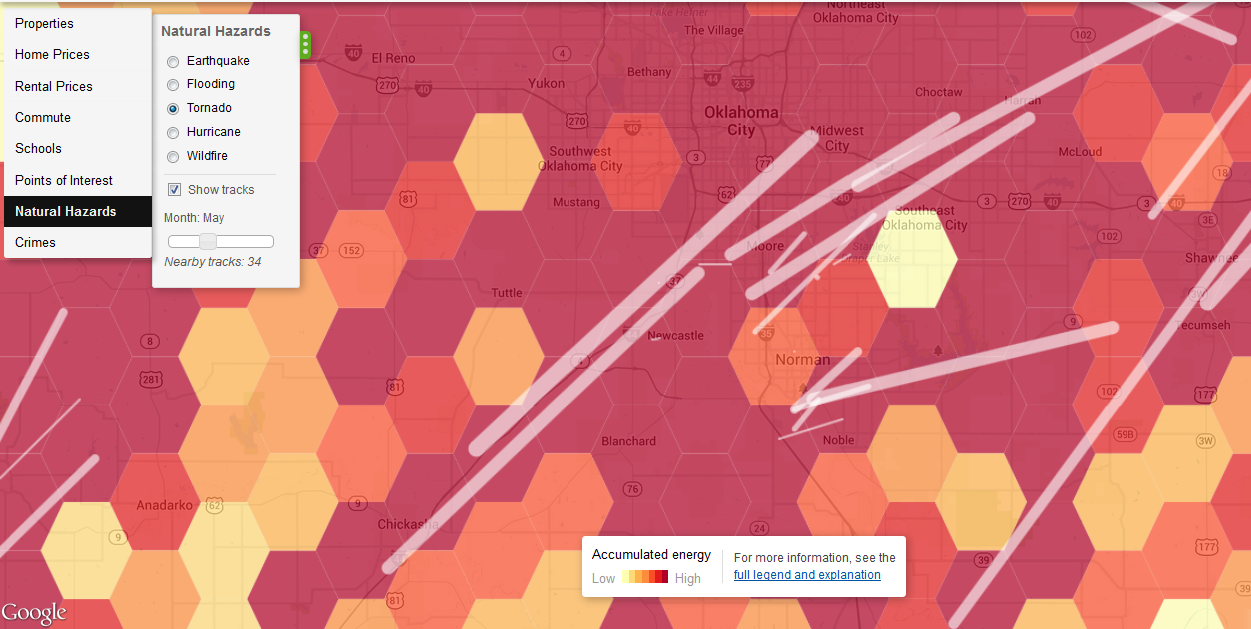
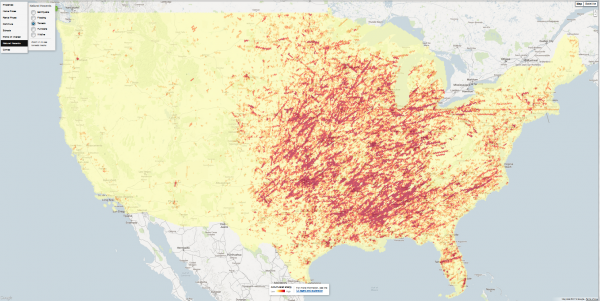
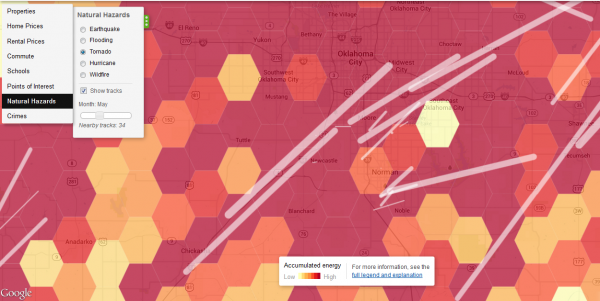
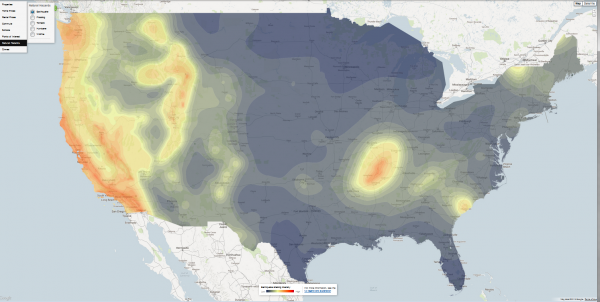
Trulia’s tornado hazard map, based on data from the National Weather Service’s Storm Prediction Center, shows that this weather phenomenon is largely absent from the American West. Drill down to the local level and the map shows the tracks of previous tornadoes. Below the national map is the area around Oklahoma City. I chose the month of May, when disasters such as the Moore Tornado of 2013 have occurred. This map uses a technique known as hexagonal binning, which employs a honeycomb grid to aggregate and visualize the data.

Trulia tornado
Source: Trulia
Trulia tornado OKC
Source: Trulia

Earthquakes

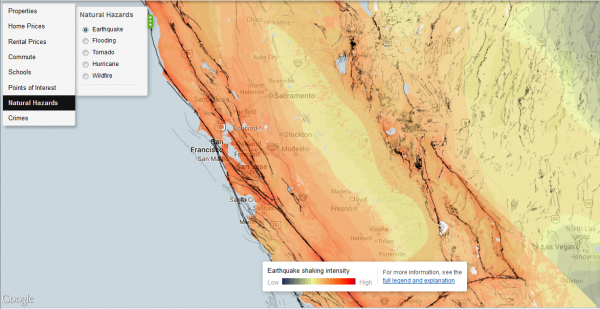
Trulia’s earthquake hazard map shows potential shaking intensity and the system of faults. Here’s how Trulia summarizes the USGS data:

The data represent a model showing a 10% probability that ground motion will reach a specified level within 50 years. Shaking potential is calculated considering historic earthquakes, slip rates on major faults and deformation throughout the region, and the potential for amplification of seismic waves by near-surface geologic materials … Faults are represented as black lines on the map. Darker lines signify a larger slip rate, which is a measurement of how fast one side of the fault slides past the other side.

Everyone knows California and the West Coast is earthquake country, but I hadn’t realized how many other, inland areas are also susceptible to shaking. Below the national map is a close-up of central California.

Trulia earthquake
Source: Trulia
Trulia earthquake SF
Source: Trulia

Telling stories with Trulia

I was pleasantly surprised by the richness of data in Trulia’s maps. Its main competitor, Zillow, doesn’t have anything that comes close. Even if you’re not in the market for a house or thinking of selling, the website is a useful resource for learning more about your community.

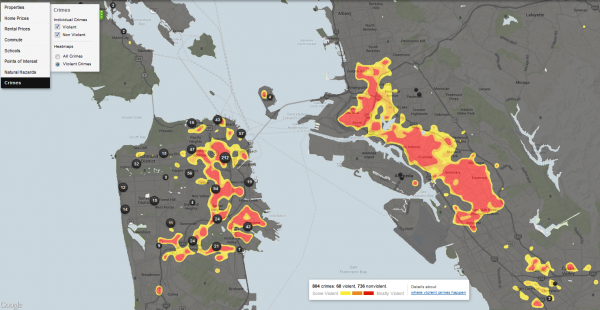
The geography of crime, shown below for the Bay Area, is a bit beyond our bailiwick here at EcoWest, but it’s certainly a key driver of growth and land-use patterns that have major environmental consequences (see this Trulia post for more on these crime maps).

Using Trulia, journalists, NGOs, researchers, and local policymakers can piece together a compelling portrait of a city or region by visualizing geographic patterns in crime, housing, transportation, education, and environmental hazards.

Trulia crime San Francisco Oakland
Source: Trulia

EcoWest’s mission is to analyze, visualize, and share data on environmental trends in the North American West. Please subscribe to our RSS feed, opt-in for email updates, follow us on Twitter, or like us on Facebook.