Category Archives: Data visualization

Our SXSW Eco presentation and the PowerPoint paradox

SXSW Eco logoI was in Austin last week, speaking at the annual SXSW Eco conference, so I wanted to share my presentation and a lesson or two I learned about PowerPoint.

The presenter’s job is becoming even more difficult in a harried era of micro attention spans. With audience members carrying multiple Internet-enabled devices at all times, there’s a lot of competing stimuli in the room. At the same time, all of this wonderful technology and gadgetry has made it easier than ever to create beautiful and informative slides, maps, graphics, and other data visualizations. It’s a PowerPoint paradox.

My talk provided an overview of the American West and two of its key environmental issues: the expanding human footprint and the questionable water supplies. You can download the PowerPoint at the bottom of the post, or watch a narrated video in this embed:

EcoWest SXSW Eco Presentation from EcoWest on Vimeo.

The SXSW Eco event is a green spin-off of the popular SXSW music, film, and interactive festivals. I felt a little lost at times because speakers were covering such a dizzying array of topics: tracking African elephants with cell phones, making American water use more sustainable, reforming Austin’s electric utility, promoting eco-friendly detergents. If there was a unifying theme, it seemed to be using technology and innovation to tackle environmental problems.

At the meeting, I had an epiphany about communications and PowerPoint. Many of the speakers were great, but I was surprised by how many audience members (including me) had their heads buried in their phones, laptops, and tablets during presentations. I suppose some people were live-tweeting or taking notes, but many appeared to be seeking novelty on social networks or working feverishly on something unrelated to the speaker. During the session breaks at the Austin Convention Center, many people’s idea of networking was logging onto the free Wi-Fi network and once again looking into a screen.

Comic Book Guy
Today’s audience is impatient, hyper-connected, and difficult to please. Source: Simpsons Wikia

My takeaway is that attention spans continue to shrink, especially among younger and tech-savvy audiences, so if you don’t have something super interesting to show or say, people will quickly tune you out and get back online.

The deck below contains 52 slides, which may seem like a lot for a 15-minute session, but I was able to get through them all. Do the math and it’s 17 seconds per slide. Now, I did grow up in New York, so no one has ever accused me of speaking with a drawl, but a good chunk of my presentation consists of photos that don’t need more than 15 seconds and animation “builds” in which I rapidly add new layers onto a map.

I’m no PowerPoint guru or master presenter, but nowadays if you want to use a screen in your talk, you almost have to show lots of slides in rapid succession to replicate surfing the web or scrolling a social media feed. If you put a slide up on your screen for more than a minute, many in the audience will get antsy and think about checking one of their own screens.

I’d love to hear readers’ thoughts and advice about presenting to today’s hyper-connected, multitasking audiences.

Downloads

EcoWest’s mission is to analyze, visualize, and share data on environmental trends in the North American West. Please subscribe to our RSS feed, opt-in for email updates, follow us on Twitter, or like us on Facebook.

Drop on the planet: 3 visualizations of Earth’s most precious natural resource

Scarcity of freshwater is a defining feature of the American West, and planet Earth.

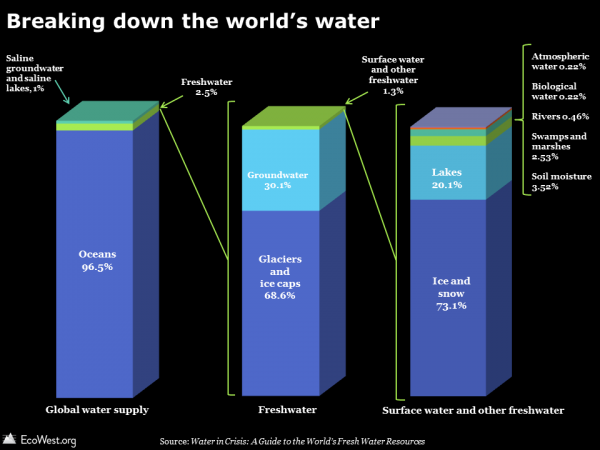
Nearly 97% of the world’s H2O is in the oceans. More than two-thirds of the globe’s freshwater is frozen in glaciers and polar ice caps.

Below are a trio of graphics to visualize water on Earth. I’ve found these slides useful for providing context in water-related presentations.

1) The world’s water: drop on a planet

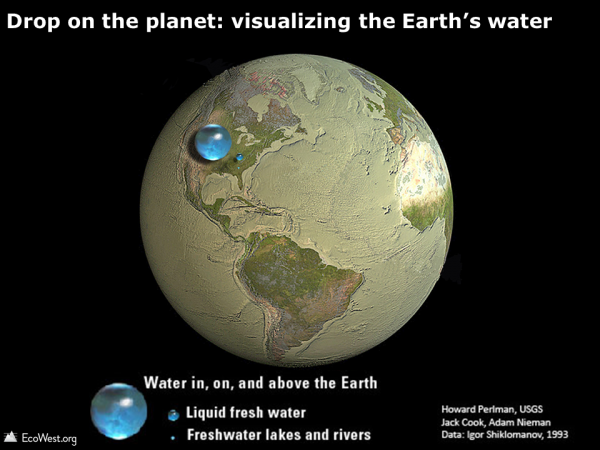
About 70% of the planet’s surface area is covered by water, but the amount is tiny when compared to the Earth’s total volume. The illustration below shows that if you collected all of the planet’s water into a single sphere, it would be 860 miles across. Situated to the right is a 170-mile-wide ball over Kentucky that represents all the fresh liquid water found in the ground, lakes, swamps, and rivers. That miniscule 35-mile-wide dot over Georgia is all the freshwater in lakes and rivers.

Water on Earth graphic
Source: U.S. Geological Survey

2) The water cycle: a closed loop

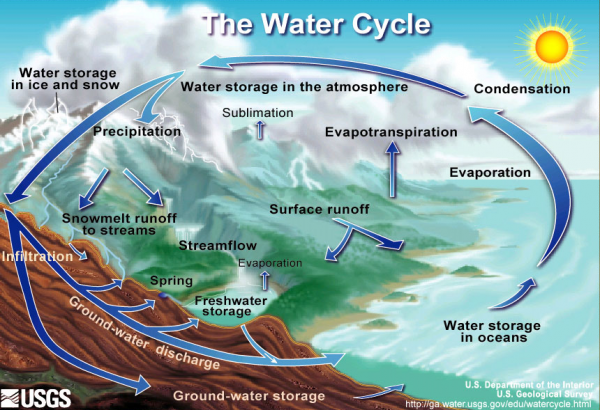
The diagram below illustrates the water cycle and a critical point: water on Earth is essentially a finite resource and the system is basically a closed one. If you want to be a stickler, it’s not a 100% closed system since there’s a bit of entry and leakage via comets depositing ice and water vapor escaping to space. This graphic also doesn’t show volcanoes emitting steam or water lost to faults on the ocean bed. But the basic point remains: we can reuse water, convert the sea into a potable supply, even try to coax the sky into precipitating with cloud seeding, but we can’t manufacture new water.

U.S. Geological Survey water cycle
Source: U.S. Geological Survey

3) Breaking down the types of water

The graphic below shows that freshwater comprises just 2.5% of the Earth’s total water supply and 69% of that freshwater is locked up in glaciers and icecaps (at least for now). Most of the remaining freshwater is found below our feet as groundwater. Sometimes this subterranean supply is relatively easy to access, but in other locations it may be too deep or costly to extract. Fresh surface water is a rare commodity on this planet. Rivers, for example, account for just 0.006% of all freshwater and 0.0002% of all water found on Earth.
Distribution of water on Earth

We have more slides covering water issues, including supply, demand, quality, infrastructure, and climate change, in our water PowerPoint presentation.

Downloads

EcoWest’s mission is to analyze, visualize, and share data on environmental trends in the North American West. Please subscribe to our RSS feed, opt-in for email updates, follow us on Twitter, or like us on Facebook.
The black and blue marble: 10 whole Earth views from space

It’s been called one of the most famous and widely distributed images in human history. The “blue marble,” a 1972 color photograph of the Earth from the Apollo 17 spacecraft, has also been credited with expanding environmental awareness around the globe and highlighting the vulnerability of our home planet.

In the four decades since the blue marble was captured on film, other astronauts and unmanned spacecraft have trained their lenses on the Earth, sometimes while in orbit, other times while racing toward another celestial body. I stumbled upon some of these images while surfing the Web recently and have collected my favorites in a PowerPoint deck that you download at the bottom of this post.

I find these images captivating, even mesmerizing. They’re also useful in creating presentations. NASA’s next generation of blue marble images can be downloaded as very high-resolution files that allow you to zoom in on an area of interest (see our earlier post to learn about similar, high-res images of the Earth’s vegetation).

We often take the 30,000-foot view here at EcoWest, trying to understand mega-trends in the American West, but occasionally it’s worth stepping back even farther, to many millions of miles away, so we can see the truly big picture. Below I describe 10 of the views, including some animations, that I found most striking (click on images to enlarge).

 1) The original blue marble

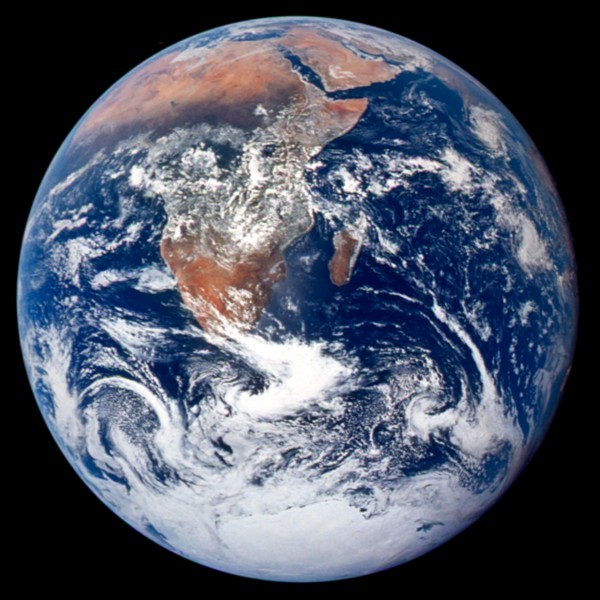
The iconic blue marble photo was taken on December 7, 1972 as the Apollo 17 spacecraft departed Earth for the moon. The image was snapped 5 hours after liftoff and 2 hours after the spacecraft left its parking orbit around Earth. The spacecraft was already 28,000 miles away from the planet and situated perfectly for the shot–with the sun behind the camera, the full disc of Earth was visible.

Blue marble photo
Source: NASA

2) Earlier color image of full Earth

The blue marble wasn’t the first time the full Earth had been photographed in color. The image below, captured by the ATS-3 communications satellite in 1967, was on the cover of the Whole Earth Catalog in fall 1968.

ATS-3 photo of Earth
Source: Wikipedia

3) Next generation blue marble

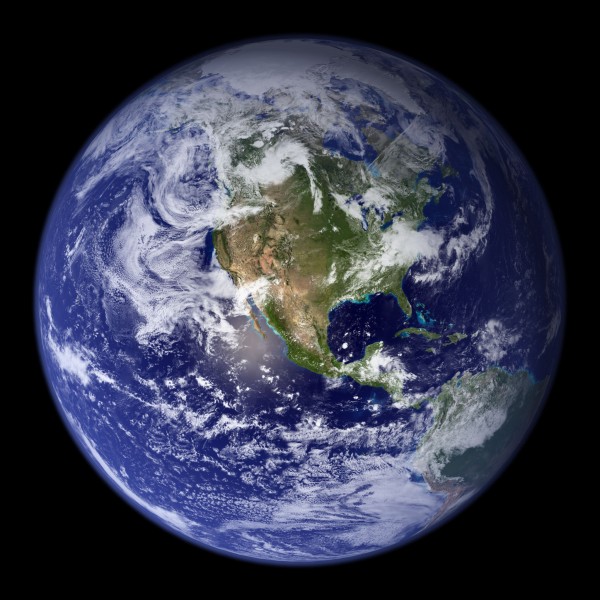
NASA’s next generation of blue marble imagery takes advantage of a variety of satellites and stitches together many months of observations to provide a clear view of Earth. Much of the data came from the MODIS device on the Terra and Aqua satellites. Below is the view of the Western hemisphere.

Source: NASA
Source: NASA

Reflecting on the blue marble images, Donald Wuebbles, an atmospheric scientist at the University of Illinois at Urbana-Champaign, described them this way:

The abundance of water on our planet visible in the “Blue  Marble” photo clearly separates us from all others in the solar system. The flows and  interactions of clouds as part of our weather also appear prominently in the photo. The  interconnectedness of all the spheres—hydrosphere, atmosphere, cryosphere, and lithosphere—into one sphere is the power of this image and of later images of the Earthtaken from unmanned spacecraft.

It’s been an epoch since I took Earth science, so I confess to looking up cryosphere (ice caps, glaciers, etc.) and lithosphere (crust and mantle).

 4) Looking down on the arctic

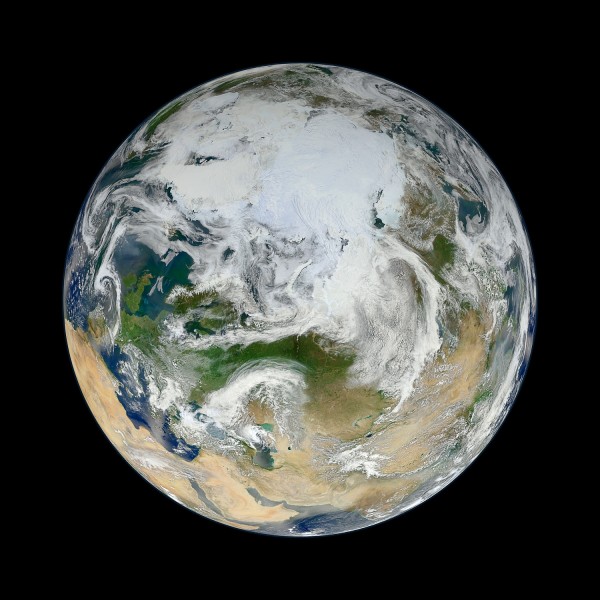
At first glance, you may not recognize the planet depicted below. That’s because you’re looking down on Earth from over Siberia, rather than from the typical equatorial vantage point. In this view of the Arctic, based on 15 passes by the Suomi-NPP satellite on May 26, 2012, you can get a sense of why melting the Greenland Ice Sheet would lead to a cataclysmic rise of sea levels by some 24 feet.

Source: NASA/GSFC/Suomi NPP

5) Night lights and the black marble

The dark side of the Earth has plenty of lights, as shown in the image below from April and May 2012. NASA’s city lights series provides a powerful summary of development patterns across the globe. The PowerPoint deck includes some close-ups of the United States, but even in this hemispheric view you can see how the country’s population is concentrated in the eastern half and along the West Coast.

City lights of North America at night
Source: NASA

6) Animation of Earth’s rotation

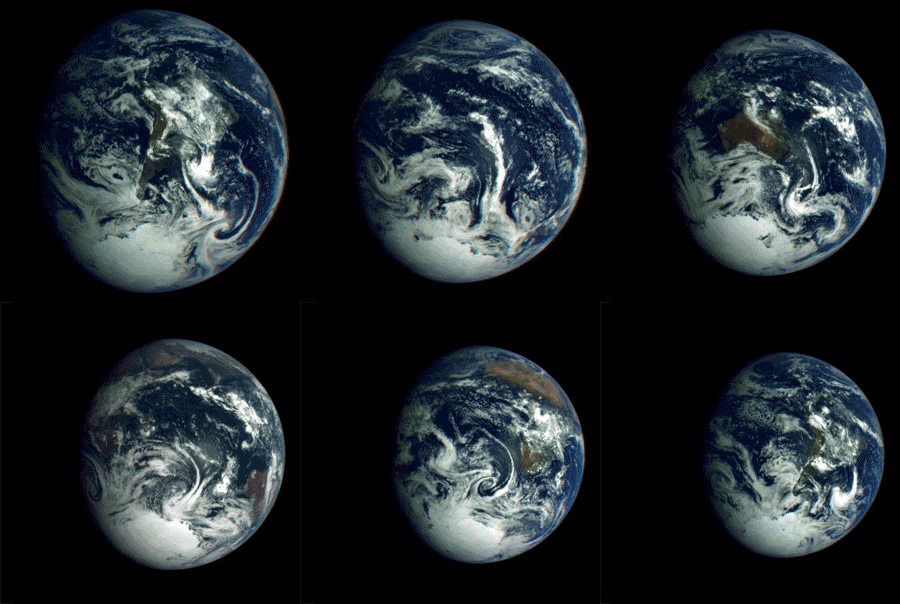
As the Galileo spacecraft departed Earth in 1990 for its exploration of Jupiter, it looked back and captured this sequence of images over a 25-hour period.

Galileo Earth animation
Source: NASA/JPL/Doug Ellison

7) Lunar transit of Earth

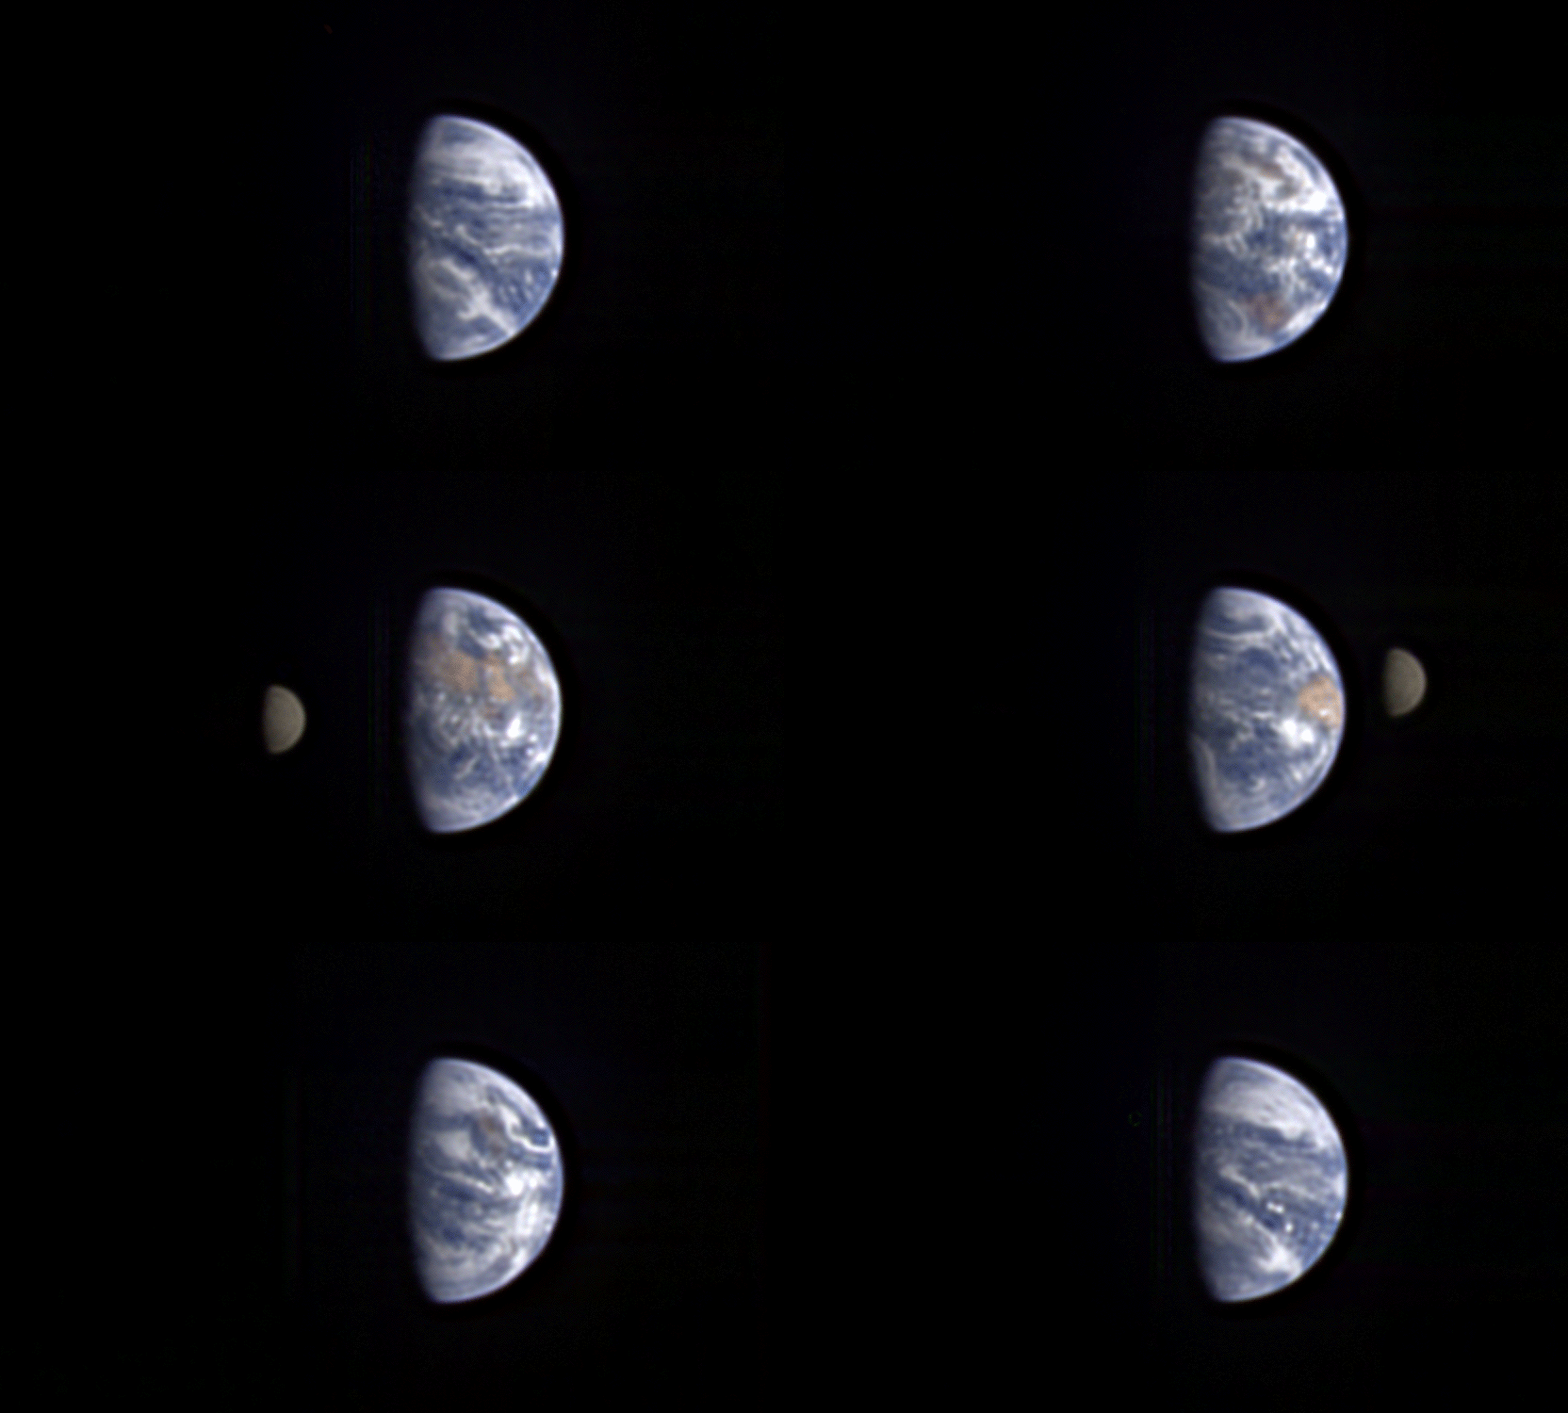
The Deep Impact spacecraft, launched in 2005 to study comets, sent back stunning images of the moon transiting the Earth. This animation shows a lunar transit in 2008 from 31 million miles away.

Earth moon animation
Source: NASA/JPL/UMD

8) Solar eclipse viewed from lunar orbiter

The Lunar Reconnaissance Orbiter, launched in 2009, captured the May 12, 2012 solar eclipse in the image below, which shows the shadow over the Aleutian Islands.

Solar eclipse seen from moon
Source: NASA/GSFC/ASU

9) Time-lapse from the International Space Station

OK, so this one’s a little different, but I would urge you to check out the video embedded below, which shows what the Earth looks like to the crew of the International Space Station. There are some spectacular views of the night lights, aurora borealis/australis, and lightning flickering in thunderstorms. The video is a time-lapse compilation of photographs taken by the crew of the space station, which orbits about 260 miles above Earth at 17,200 mph.

Earth from Michael König on Vimeo.

10) The earth and moon from Saturn

Finally, to put things in perspective, there’s this recent view of the Earth from the Cassini spacecraft orbiting Saturn.  From 898 million miles away, our planet is just a dot.

View of Earth from Saturn

More images coming

In the years ahead, I’m sure we’ll be treated to even more stunning images of planet Earth. The Deep Space Climate Observatory, originally proposed by former Vice Preident Al Gore and possibly inspired by the original blue marble photo, is scheduled to be launched in 2015 by the SpaceX company. The observatory, which became a political football, will be situated about 1 million miles from the planet, at a point where the gravitational pull of the Earth and Sun cancel. From there it will warn of potentially harmful solar activity, and have a continuous view of the sunlit side of Earth.

Data sources

The best source I found for whole Earth images is this page on the Planetary Society’s website.

NASA’s blue marble images are found on this page and described further here.

Downloads

EcoWest’s mission is to analyze, visualize, and share data on environmental trends in the North American West. Please subscribe to our RSS feed, opt-in for email updates, follow us on Twitter, or like us on Facebook.