Google has just released an interesting tool for tracking environmental changes through satellite imagery.
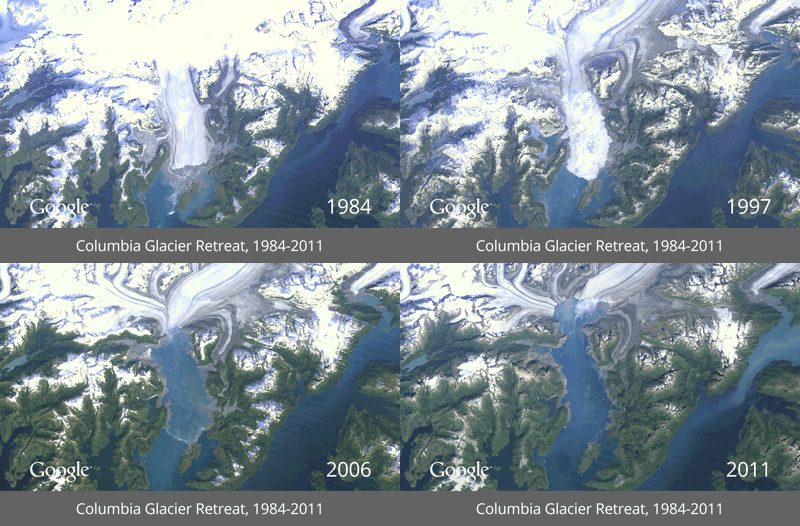
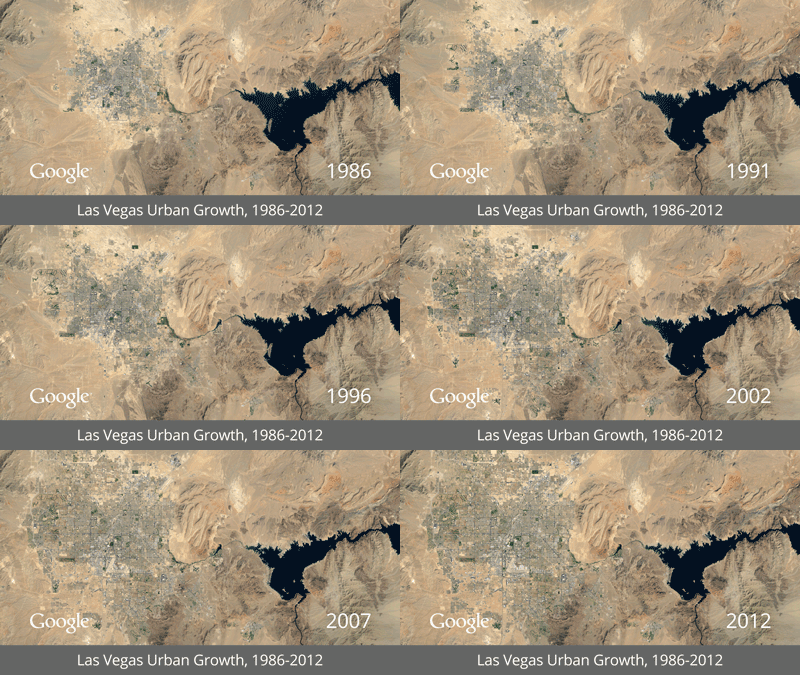
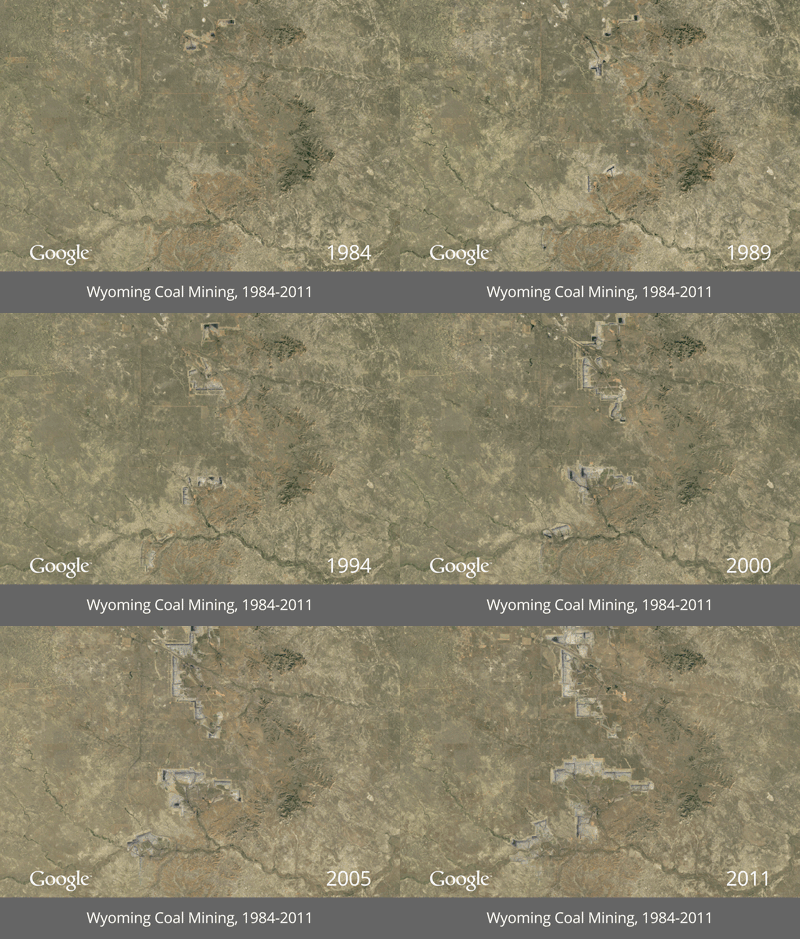
Timelapse shows changes to the Earth’s surface over nearly three decades, from 1984 to 2012. Each frame in these animations is a year of imagery from the Landsat satellite program.
Google has put together some pre-made views and below I’ve pasted the animations from North America. There’s also a description of each animation in this article in Time.
Las Vegas urban growth
Wyoming coal mining
Columbia glacier retreat
I found the Las Vegas view most striking. It’s similar to an animation of the city’s growth that I wrote about here.
What’s really cool about this tool is that you can zoom in to any area on the globe and see how the landscape has been evolving. I focused in on Tucson, where I lived for many years, and I could easily see the growth, especially new golf courses in the desert, as well as the scars left behind by wildfires that struck the nearby Santa Catalina range from 2002 to 2004.
Unfortunately, you can’t zoom in very close with the Timelapse tool, and it doesn’t look like there’s a way to save your own animation. But maybe that’s coming?
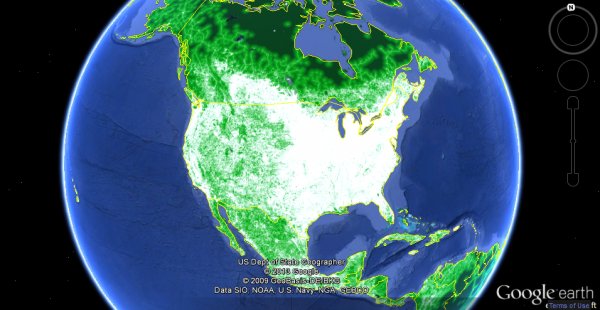
I noticed that the Google Earth Engine site also provides an interesting data set on roadless areas that shows places around the globe that are more than 1 kilometer from a road, railway, or navigable river. Below is a screen shot of the dataset, which I’d like to explore further.
Global roadless areas
EcoWest’s mission is to analyze, visualize, and share data on environmental trends in the North American West. Please subscribe to our RSS feed, opt-in for email updates, follow us on Twitter, or like us on Facebook.


