Scarcity of freshwater is a defining feature of the American West, and planet Earth.
Nearly 97% of the world’s H2O is in the oceans. More than two-thirds of the globe’s freshwater is frozen in glaciers and polar ice caps.
Below are a trio of graphics to visualize water on Earth. I’ve found these slides useful for providing context in water-related presentations.
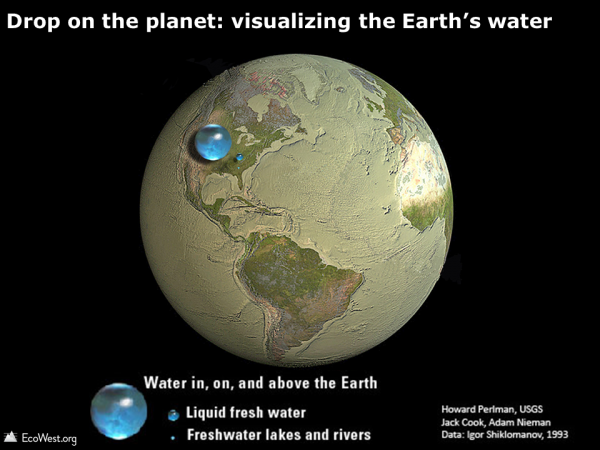
1) The world’s water: drop on a planet
About 70% of the planet’s surface area is covered by water, but the amount is tiny when compared to the Earth’s total volume. The illustration below shows that if you collected all of the planet’s water into a single sphere, it would be 860 miles across. Situated to the right is a 170-mile-wide ball over Kentucky that represents all the fresh liquid water found in the ground, lakes, swamps, and rivers. That miniscule 35-mile-wide dot over Georgia is all the freshwater in lakes and rivers.

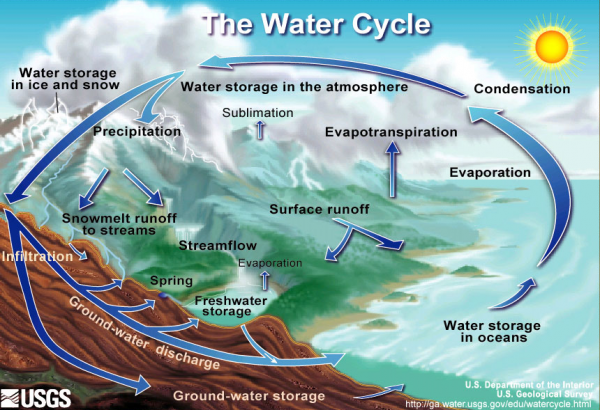
2) The water cycle: a closed loop
The diagram below illustrates the water cycle and a critical point: water on Earth is essentially a finite resource and the system is basically a closed one. If you want to be a stickler, it’s not a 100% closed system since there’s a bit of entry and leakage via comets depositing ice and water vapor escaping to space. This graphic also doesn’t show volcanoes emitting steam or water lost to faults on the ocean bed. But the basic point remains: we can reuse water, convert the sea into a potable supply, even try to coax the sky into precipitating with cloud seeding, but we can’t manufacture new water.

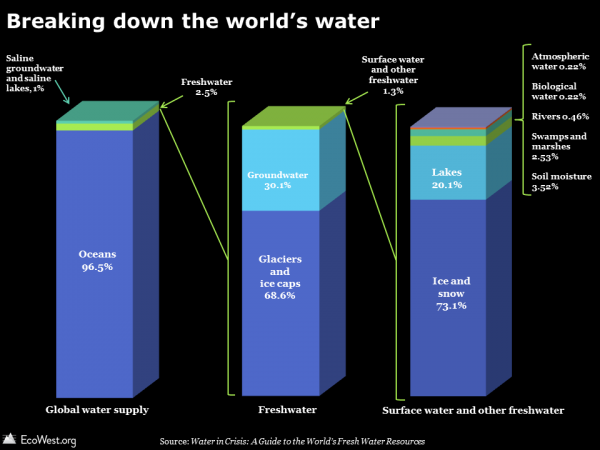
3) Breaking down the types of water
The graphic below shows that freshwater comprises just 2.5% of the Earth’s total water supply and 69% of that freshwater is locked up in glaciers and icecaps (at least for now). Most of the remaining freshwater is found below our feet as groundwater. Sometimes this subterranean supply is relatively easy to access, but in other locations it may be too deep or costly to extract. Fresh surface water is a rare commodity on this planet. Rivers, for example, account for just 0.006% of all freshwater and 0.0002% of all water found on Earth.

We have more slides covering water issues, including supply, demand, quality, infrastructure, and climate change, in our water PowerPoint presentation.
Downloads
EcoWest’s mission is to analyze, visualize, and share data on environmental trends in the North American West. Please subscribe to our RSS feed, opt-in for email updates, follow us on Twitter, or like us on Facebook.

