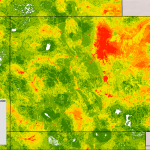
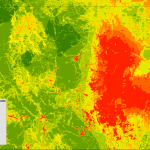
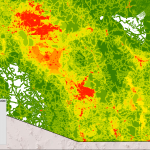
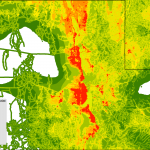
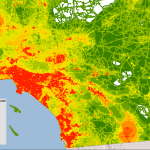
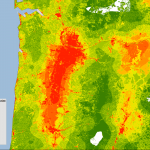
Just a quick post to let you know that I’ve created a gallery of high-resolution maps depicting the human footprint in each of the 11 Western states, plus some major cities in the region.
I wrote about this dataset a few weeks ago and wanted to share some more detailed, zoomed-in views. White indicates areas with the least human impact, followed by green for places where the footprint is minimal, while orange and red areas are where people have done the most to transform native ecosystems.
Below is the gallery, which also available on this page.
The human footprint map is based on the work of U.S. Geological Survey (USGS) scientists and was the basis of a 2008 paper in Ecological Applications by Matthias Leu, Steven E. Hanser, and Steven T. Knick. The scientists focused on 14 features, including the location of cities, farms, roads, canals, power lines, oil and gas wells, and human-caused wildfires.
Please let me know if you have any issues viewing the maps. This is the first time I’ve used the WordPress gallery feature and I’m wondering if it’s an effective tool for sharing images.
Same goes for anything on EcoWest: as we get off the ground, we’re looking for feedback, suggestions, and other comments from users so we can make this site as useful as possible. Thanks!
EcoWest’s mission is to analyze, visualize, and share data on environmental trends in the North American West. Please subscribe to our RSS feed, opt-in for email updates, follow us on Twitter, or like us on Facebook.


