All posts by Mitch Tobin

Mitch Tobin, the editor of ecowest.org, is owner of Sea to Snow Consulting and was previously communications director at California Environmental Associates. Prior to joining CEA, Mitch was a newspaper reporter at the Napa Valley Register, Tucson Citizen, and Arizona Daily Star, where he covered water, environmental, and border issues for five years. He was also a contributor to High Country News. Mitch's first book, Endangered (Fulcrum 2010), evaluates the effectiveness of the Endangered Species Act and received a gold medal in the 2011 Independent Publisher Book Awards.

Visualizing Colorado River challenges and options

The Colorado River, lifeblood of the Southwest, is in trouble. Demand for river water is rising as the region’s population continues to grow, but the Colorado’s inherently capricious supply is increasingly in doubt due to climate change.

A federal report released in December took an exhaustive look at the challenges facing the Colorado River Basin and it examined the options for dealing with expected shortages.  I’ve gone through the Colorado River Basin Water Supply and Demand Study and pulled out the key figures, which you can download at the bottom of this post.

Colorado River Bain Study from EcoWest on Vimeo.

Shortage projected

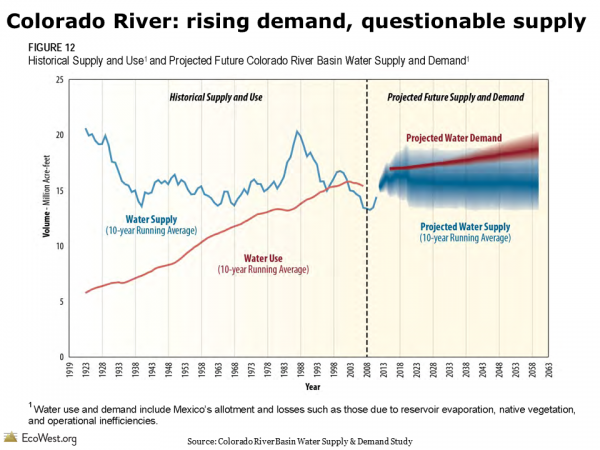
If I had to pick one graphic that summed up the dilemma facing the Colorado River, it would be this one:

Colorado River historical and projected water use and supply

Looking back in time, the graphic shows that water use in the basin steadily increased during the 20th century, but the river’s flow was predictably erratic (that blue line is a 10-year moving average but it’s still as uneven as the basin’s topography).

Looking ahead, water demand is expected to keep growing (the fuzzy areas indicate the uncertainty in the projections). Predicting the flow of the Colorado decades into the future is a tough task, but the study concluded that the supply would probably decrease, as indicated by the gentle downward slope of the blue line. By 2060, the imbalance between supply and demand is expected to be about 3.2 million acre-feet.

Comparing costs of solutions

Besides identifying the problem, the Basin Study evaluated a wide variety of proposals for addressing the shortfall—everything from increasing water conservation in cities and on farms, to building massive new pipelines and desalination plants, even far-fetched ideas like towing icebergs to Southern California.

I extracted data from a summary table in the study in order to visualize how these options compare, both in price and in how much water they’ll yield.

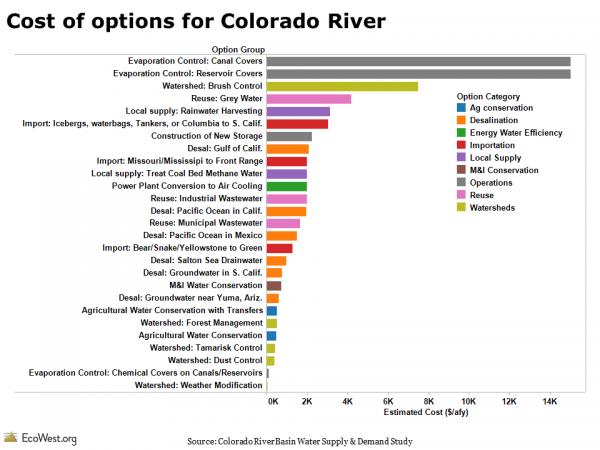
In the graphic below, I’ve ranked all of the options from highest to lowest cost (the unit here is dollars per acre-foot per year). I’ve also color-coded them by category.

Cost of options for Colorado River

As you can see, the range of costs is enormous, but there are some general patterns. Conservation measures are among the cheapest, while desalinating ocean water or covering reservoirs to reduce evaporation are pricey. (For a few of these options, the study provided a range of costs, but for simplicity’s sake I’ve used the average in this graphic.)

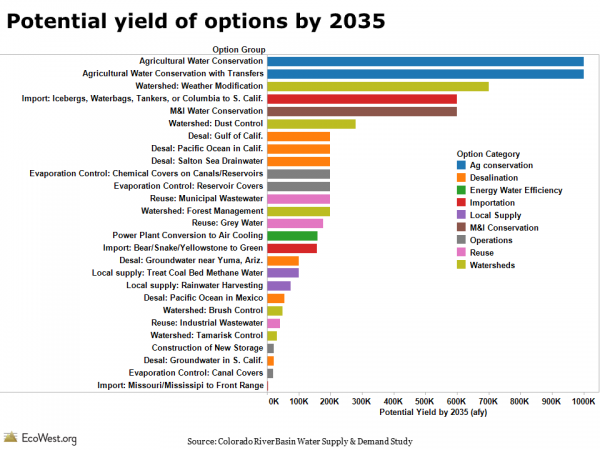
The chart below ranks the options by how much water they’re expected to yield in 2035.

Potential yield of options for Colorado River

Water conservation in agriculture and among municipal and industrial (M&I) users is projected to yield the most, but weather modification (aka cloud-seeding) also performs well on this measure.

I combined the cost and yield data into one graphic by varying the width of the bars by the volume of water that each strategy is expected to produce. The thicker the bar, the greater the yield. In this case, I used the projections for 2060, rather than 2035.

Cost and yield of options for Colorado River

In releasing the Basin Study in December, federal officials stressed the conservation options over massive new infrastructure projects, such as pumping the Missouri or Mississippi rivers to the Colorado Front Range. These graphics show why that’s pretty much a no-brainer: conservation delivers more bang for the buck and avoids the enormous environmental impacts of augmentation projects.

Downloads

Data sources

You can download the Basin Study and associated reports here.

The Denver Post had a good overview of the Basin Study’s release. See recent stories by the Los Angeles Times and Associated Press  for more on what the federal government is doing to follow up on the report.

EcoWest’s mission is to analyze, visualize, and share data on environmental trends in the North American West. Please subscribe to our RSS feed, opt-in for email updates, follow us on Twitter, or like us on Facebook.

Wildfire ignition trends: humans versus lightning

The Western wildfire season is well underway, so I thought this would be a good time to examine a key question: what causes wildfires?

Basically it boils down to two ignition sources—humans and lightning—but the balance between these two causes varies dramatically across the country. We have a dashboard on ignition that illustrates the data and I’ve created a PowerPoint presentation that you can download at the bottom of the post.

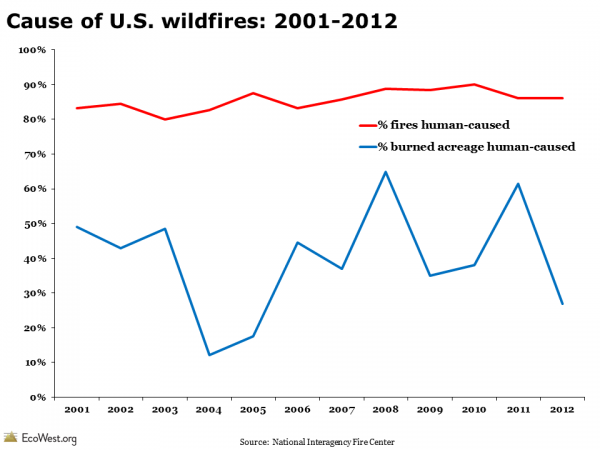
This graphic summarizes the national picture since 2001:

National wildfire cause

Two metrics: fires and acres

Over the past dozen years, more than 80 percent of all wildfires have been caused by people and that rate has been very steady. But if you look at the acreage burned, as opposed to the number of fires, humans are usually responsible for less than half the total.

Why the difference? Lightning-sparked fires in remote parts of the West and Alaska may get very large before they are contained; in some cases, these blazes are allowed to burn to reduce fuels. By contrast, many human-caused fires start in populated areas and are quickly controlled.

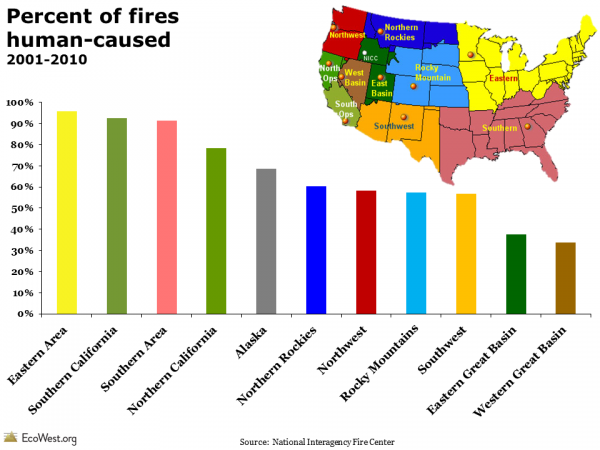
You can see the regional differences in the chart below, which shows what percent of fires were human-caused from 2001 to 2010. The regions are defined by the National Interagency Fire Center.

Regional wildfire cause

Back East and in California, humans are responsible for starting the vast majority of fires, whereas in the Great Basin, it’s less than 40 percent. This regional breakdown suggests that fire prevention programs will be more effective in some areas than others.

Explore data in our dashboard

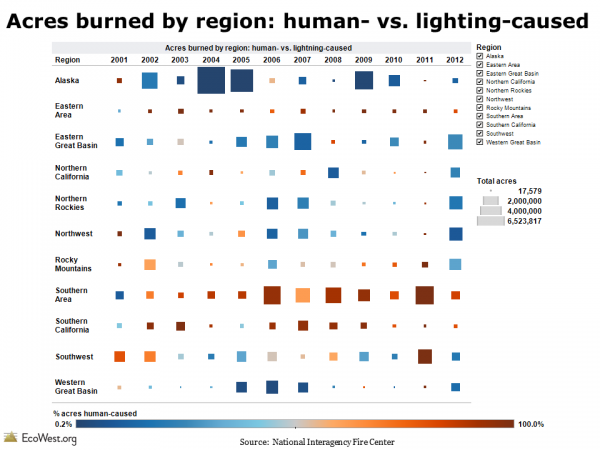
Our wildfire ignition dashboard presents this information in a different way and allows you to interact with the data. The screenshot below shows the number of acres burned in each region:

Acres burned by region

There have been some huge wildfires up in Alaska and nearly all the acreage burned was due to lightning-sparked blazes. Conversely, human-caused wildfires predominate in the Southern area. In other regions, such as the Southwest, the situation is more variable. In some years, humans are responsible for the bulk of acres burned, but in other years most of the burning is due to lightning

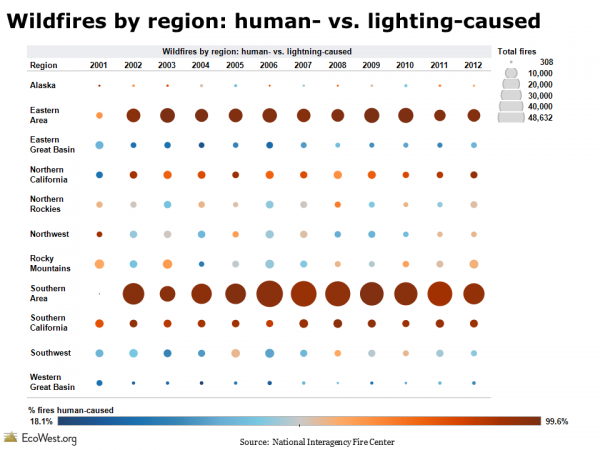
The screenshot below shows the number of wildfires in each region. The Southern and Eastern regions, where the bulk of the nation’s population lives, have the greatest number of human-caused wildfires, but in places like the Great Basin, where relatively few people live, the vast majority of fires are caused by lightning.

Fires by region

Takeaways

The large number of lightning-caused fires out West should remind us that wildfires are inevitable in the region. Measures like campfire bans and public lands closures, which may succeed in cutting the number of human-caused fires, can only do so much.

This data also illustrates why it’s so important for us to get beyond national-level statistics when analyzing wildfires. Otherwise we end up lumping together lightning-caused blazes in the unpopulated Alaskan tundra and arson fires in the chaparral of suburban Los Angeles.

Downloads

Data sources

The National Interagency Fire Center publishes data on the cause of wildfires on this page.

EcoWest’s mission is to analyze, visualize, and share data on environmental trends in the North American West. Please subscribe to our RSS feed, opt-in for email updates, follow us on Twitter, or like us on Facebook.
Gallup finds rising hostility toward environmentalists

Gallup has been polling Americans on the environment for decades and it’s one of the best sources I’ve found for tracking long-term trends in public opinion on conservation issues.

Something that struck me while analyzing this data is an apparent increase in hostility toward the environmental movement over the past decade or so.

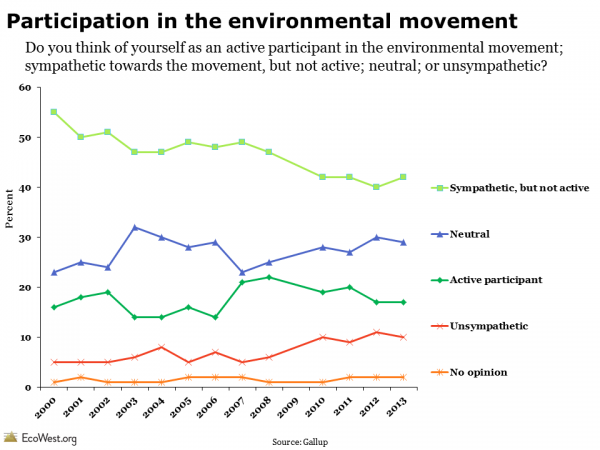
The graphic below from our politics deck shows trends in participation in the environmental movement from 2000 to 2013 (Gallup apparently skipped the question in 2009).

Gallup environmental poll

Most Americans say they’re concerned about environmental issues, but fewer than one in five consider themselves active participants in the movement. Since 2008, that figure has fallen from 22 percent to 17 percent.

About two-fifths of Americans consider themselves sympathetic to the movement but not active, but the percentage of people saying they were “unsympathetic” has doubled since the early 2000s, from about 5 percent to 10 percent.

If you add the active participants (17 percent) and sympathizers (42 percent), you reach 59 percent, a healthy majority of Americans, but that’s down from 71 percent in 2000. Similarly, if you add the unsympathetic and neutral view points, it sums to 39 percent today, up from 28 percent in 2000.

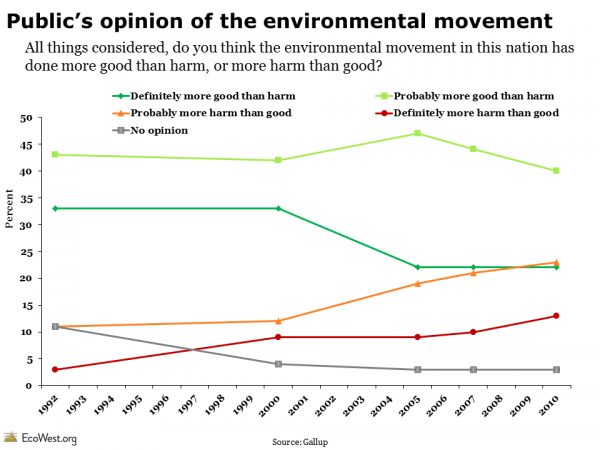
Another survey question, which Gallup last asked in 2010, also suggests there is some rising animosity toward environmentalists.

Gallup environmental poll

The percentage of Americans saying the movement has definitely or probably done more harm than good rose from 14 percent in 1992 to 36 percent in 2010. Conversely, the fraction of Americans who said the movement had definitely or probably done more good than harm decreased from 76 percent in 1992 to 62 percent in 2010.

I don’t want to make too much out of these survey findings. The jump in unsympathetic Americans from 5 to 10 percent over 13 years isn’t exactly a groundswell of opposition to the environmental movement. But if I were a leader of an environmental NGO, this public opinion data would be troubling.

Why is there increasing negativity toward environmentalists? Other polling results we’ve examined show that support for environmental protections ebbed a bit during the Great Recession, so it would seem to follow that impressions of the movement would also take a hit during tough economic times.

In recent years, conservative politicians, opinion leaders, and interest groups have launched a barrage of attacks and negative advertising against environmentalists, so that may be a factor as well.

What do you think? Are there other reasons why more Americans view the environmental movement in a negative light?

Downloads

Data sources

Results from Gallup’s environmental polling are summarized on this page and contained in our politics deck, which also has data from other environmental polls.

EcoWest’s mission is to analyze, visualize, and share data on environmental trends in the North American West. Please subscribe to our RSS feed, opt-in for email updates, follow us on Twitter, or like us on Facebook.