All posts by Mitch Tobin

Mitch Tobin, the editor of ecowest.org, is owner of Sea to Snow Consulting and was previously communications director at California Environmental Associates. Prior to joining CEA, Mitch was a newspaper reporter at the Napa Valley Register, Tucson Citizen, and Arizona Daily Star, where he covered water, environmental, and border issues for five years. He was also a contributor to High Country News. Mitch's first book, Endangered (Fulcrum 2010), evaluates the effectiveness of the Endangered Species Act and received a gold medal in the 2011 Independent Publisher Book Awards.

What is the West? 5 ways the region stands out

The “West” is as much a cultural invention as a geographical construct, so it’s a difficult place to define. Ranging from the driest of deserts to the wettest of rainforests, the lands of Western North America include an incredible diversity of ecosystems and people.

But in many ways, the American West does hang together as a region. The public domain dominates many states and the landscape tends to be much drier than the rest of the country. It is a land with limited water supplies, but vast tracts of open space, a region where extreme topography gives rise to an exceptionally rich array of species.

The West is complex and defies easy categorization, but below I explain EcoWest’s geographic focus and discuss the five characteristics that set the region apart. Links to a supporting PowerPoint deck are at the bottom of this post.

What is the West? from EcoWest on Vimeo.

The 11 Western states

Broadly speaking, EcoWest covers environmental trends in Western North America, but our research has focused on the 11 contiguous Western states: Arizona, California, Colorado, Idaho, Montana, Nevada, New Mexico, Oregon, Utah, Washington, and Wyoming.
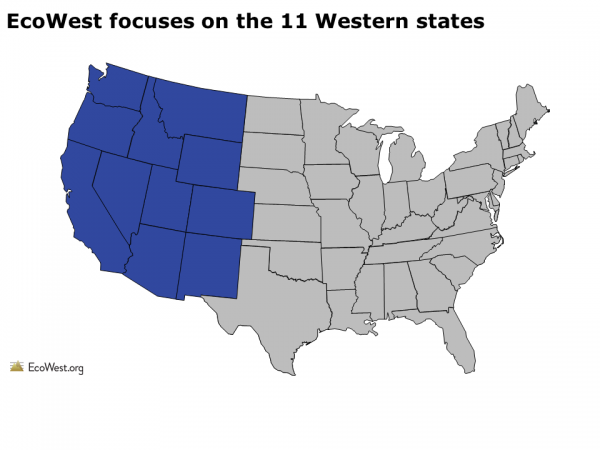
EcoWest focus
Admittedly, this focus excludes parts of Western North America, including Alaska, Western Canada, and Northern Mexico. Some of EcoWest’s resources also cover these areas, but data availability and a need to constrain our research led us to concentrate on 11 states that share some common qualities.

Compared to the rest of the country, I think the 11 Western states stand out in five dimensions:

1)     Abundant public land

The West’s prevalence of public land—most of it federal—sets the region apart from the rest of the country and has played a pivotal role in its evolution. This pattern of land ownership explains why so much of the West has remained relatively wild. The Bureau of Land Management and Forest Service are the biggest landowners, but the West is also home to considerable tracts of tribal and state property. Public lands certainly aren’t immune to development pressures, especially because many are managed under the “multiple use” doctrine that allows grazing, mining, logging, energy development, motorized recreation, and other human activities. But all that public land is a major reason why so much of the West is unpopulated.
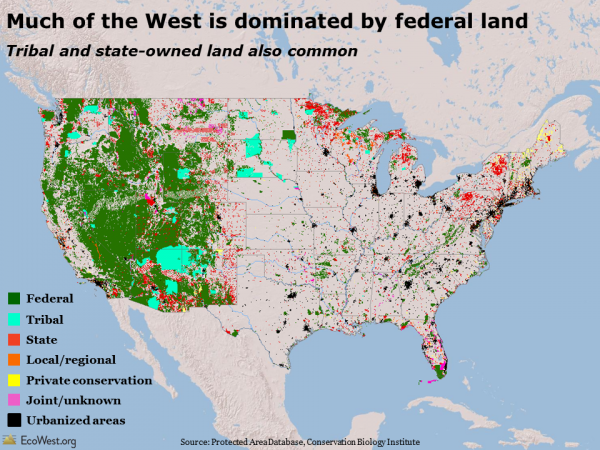
Federal land

2)     Aridity, with some exceptions

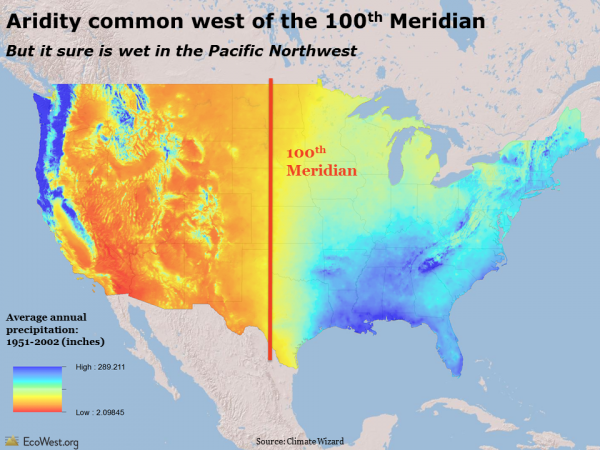
As you move west across the United States, the climate generally gets drier, with the notable exceptions of the Pacific Coast, Cascade Mountains, and Sierra Nevada Range. West of the 100th Meridian, irrigation is usually required to support agriculture and river flows tend to depend on melting snowpack from the mountains. Every Western state includes some very arid terrain that is far drier than anything back East, even Washington and Oregon, where the Cascade Mountains cast a stark rain shadow.  Another striking feature of the West’s climate is the spottiness of precipitation patterns and the close proximity of wet and dry areas.
Precipitation

3)     Rollercoaster topography

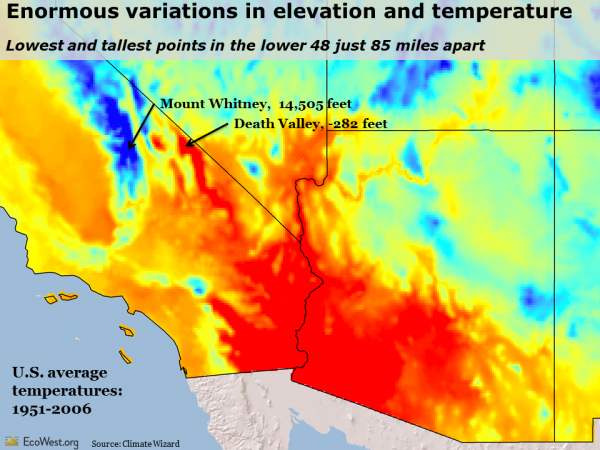
The West’s huge variance in precipitation is matched by its wild swings in temperature. Much of this is due to the region’s legendary topography. For example, the scorching desert of Death Valley, 282 feet below sea level and the lowest point on the continent, is only 85 miles away from the snow-capped peak of Mount Whitney, 14,505 feet above sea level and the tallest point in the contiguous 48 states.
temperature variation

4)     Diversity of species and ecosystems

The broad spectrum of elevations, temperatures, and precipitation patterns explains why the West is home to such a diverse set of ecosystems and species. In Southern Arizona, for instance, the valley bottoms are deserts filled with cacti, but the mountain ranges are two miles above sea level and support lush forests harboring moss and mushrooms. The map below shows the West’s various ecoregions, each of which is a unique ecological neighborhood that supports an impressive diversity of plants and animals, many of them found nowhere else on the planet.
Ecoregions

5)     Growing population

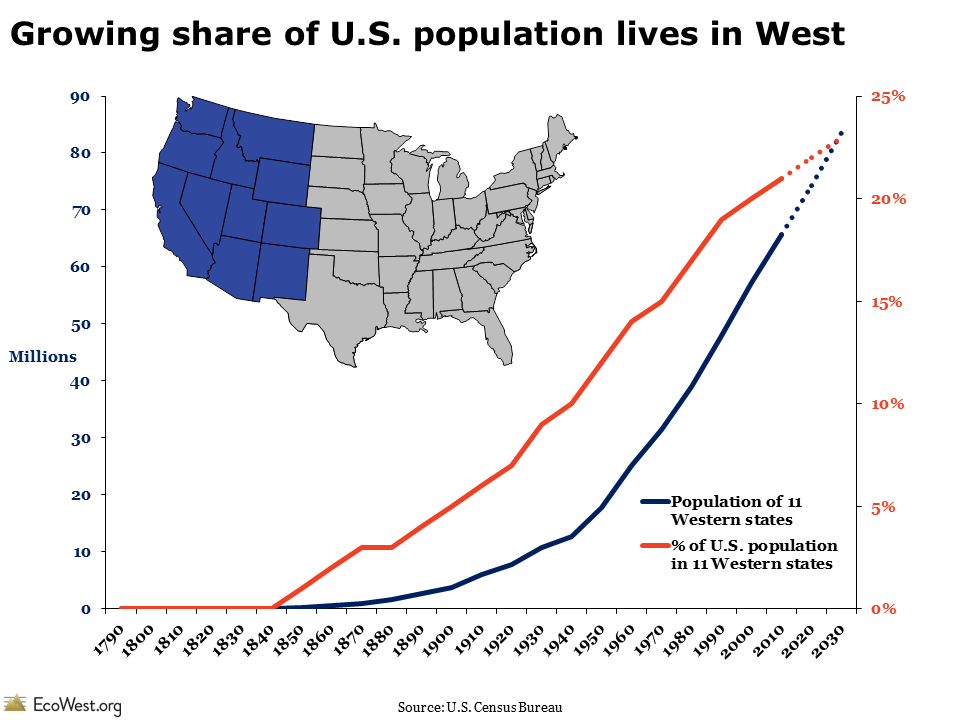
The preceding four factors are natural ones and are as true today as they were centuries or even millennia ago. But a final, human factor is also worth noting. The West’s population has been booming for decades. By 2030, the region is expected to be home to a quarter of all Americans, up from essentially 0 percent in 1830 and 9 percent in 1930. To be sure, other parts of the United States, such as the South, are also growing. But the steady influx of new residents in the West—and their growing demands on natural resources—is the fundamental challenge facing the region and the leitmotif in its environmental history.
western population

How would you define the West?

Defining the region as the 11 Western states has some shortcomings. Wildlife doesn’t respect lines on maps. Issues like the Keystone XL pipeline and the environmental impact of the border fence in the Southwest highlight how Canada, the United States, and Mexico are economically and ecologically integrated. We had to draw the line somewhere, but I’d be curious to hear feedback on this decision.

Likewise, I wonder if the five factors I describe above are the right ones. Are there other geographical, physical, cultural, political, or social dimensions that define the West?

Downloads

EcoWest’s mission is to analyze, visualize, and share data on environmental trends in the North American West. Please subscribe to our RSS feed, opt-in for email updates, follow us on Twitter, or like us on Facebook.

Survey says: water bills are rising

In the West and around the nation, the price of water keeps going up.

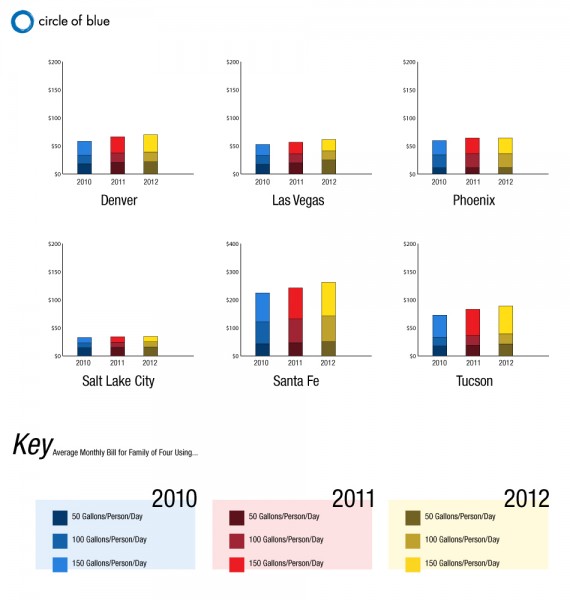
Since 2010, Circle of Blue has been gathering water rate data in the 20 largest U.S. cities, plus 10 regionally representative cities. From 2011 to 2012, single-family residential water prices rose an average of 7.3 percent; since 2010, the increase is nearly 18 percent.

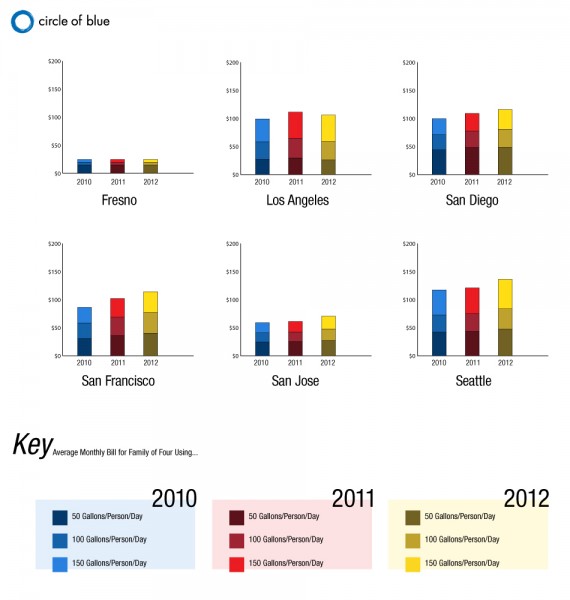
The graphics below show how water bills have changed in Western cities. One interesting feature of these charts is that they analyze water use under three different scenarios: low use (50 gallons per person daily), medium use (100 gallons per person daily), and high (150 gallons per person daily.) To promote conservation, many Western utilities have a progressive rate structure, which charges customers more per gallon if their use exceeds certain thresholds.

Mountain west water rates

Mountain Water PriceWest coast water rates WestCoastWaterPrice

On the national level, the price of water is rising at a pace much faster than the overall rate of inflation. The graphic below, from the Institute of Public Utilities at Michigan State University, compares the costs of various utilities and water/sewer bills really stand out.

Trends in utility prices

CPItrends Many Western utilities are searching for new (expensive) supplies to meet the rising demands of the growing customer base, putting upward pressure on rates. But the nation’s crumbling water works are perhaps an even bigger driver of the increasing costs, as Circle of Blue notes:

The upward trend for rates is an inherent feature of the water sector. Compared with other utilities, water departments require significantly more assets — pumps, pipes, and plants — to generate revenue. All of that hardware is expensive to maintain, and, as the fountain of water main breaks across the U.S. attests, a good portion of this infrastructure has come to the end of its effective life. The American Water Works Association recently estimated that replacing the nation’s pipes alone will cost $US 1 trillion over the next 25 years. Most of this will come from ratepayers, who pay as much as 99 percent of all money that is spent on water supply systems, according to the U.S. Conference of Mayors

Rising prices are generally portrayed as a bad thing in the media, and I’d just as soon spend my money on something other than my monthly water bill, but the bright side to increasing prices is that it can encourage more efficient water use.

For more on these issues, check out our water deck, which includes some slides on the price of water and the sorry state of our nation’s water infrastructure.

EcoWest’s mission is to analyze, visualize, and share data on environmental trends in the North American West. Please subscribe to our RSS feed, opt-in for email updates, follow us on Twitter, or like us on Facebook.
The growth of land trusts: 2000 to 2010

The American West is full of public land, but private property is critical for conserving the region’s wildlife, open space, and other natural resources. Often located along biologically rich streams and rivers, private lands also serve as connective corridors between vast, undeveloped tracts managed by the Forest Service, the Bureau of Land Management, and other agencies.

Because private property is so important for landscape connectivity, endangered species, and the overall ecological health of the West, land trusts have become key players in conservation world. These nonprofit organizations work with private landowners to protect valuable habitat and open space, often by creating conservation easements that perpetually prevent harmful development on the property.

By the end of 2010, land trusts had conserved some 47 million acres, an area more than double the size of all the national parks in the contiguous United States. The figure has increased by 10 million acres since 2005 and it has risen by more than 100 percent since 2000, when 23 million acres were protected.

Every five years, the Land Trust Alliance conducts a nationwide census. I’ve created some dashboards to illustrate the findings on this page. The slide show below summarizes the growth of land trusts from 2000 to 2010 and the geographic patterns in their activity (download links are at the bottom of this post).

The growth of land trusts: 2000 to 2010 from EcoWest on Vimeo.

Easements restrict development

Conservation easements are the bread and butter of many land trusts. Easements permanently protect private land, but sometimes they allow limited housing, water use, and other development. There’s typically a tax benefit to these voluntary agreements.

On a nationwide map, it’s hard to pick out the location of easements because the parcels tend to be small and scattered. But in a state like Montana, you can see that they’re a significant presence.

Conservation easements in Montana

In smaller northeastern states, land trusts have been particularly active. In Vermont, 10 percent of the state is protected by land trusts; in Maine, it’s 8 percent. Out West, where many states are dominated by federal land, the figures are much lower, with California and Colorado leading the way at about 2 percent.

Activity varies greatly across nation

Land trusts are found in virtually every state, but the highest concentrations are in California, the Northeast, and the Upper Midwest. In the West, Colorado and Washington each have more than three dozen land trusts, but many inland states, such as Nevada, Utah, Wyoming, and New Mexico, have fewer than 10.

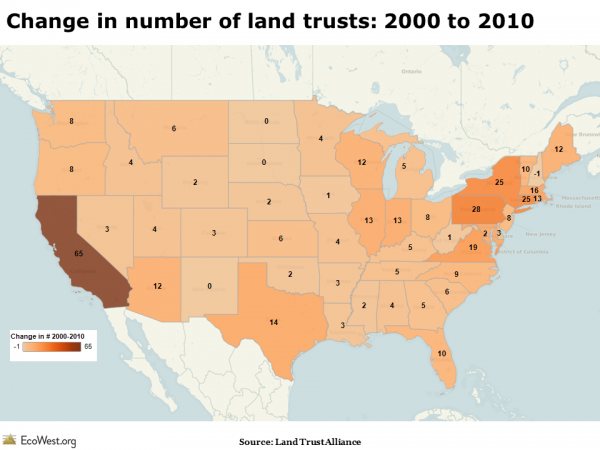
The map below shows the change in the number of land trusts from 2000 to 2010. You can see that California was far and away the leader, with 65 new land trusts created. Arizona gained 12 in the first decade of the 21st century, while Oregon and Washington each added 8.

Growth in land trusts

In terms of acreage protected, the greatest increase was in Maine, where nearly 1.7 million acres were added. Out West, California, Colorado, and Montana saw the biggest rise.

Accreditation on the increase

Land trusts come in all shapes and sizes, but there is a growing movement in the field toward accreditation to ensure the organizations follow best practices for finance and governance.

Since 2008, more than 135 land trusts have been accredited. About two-thirds of land trusts that are eligible but haven’t yet applied for accreditation say they are planning to do so. Many accredited land trusts are found in the West, with California, Colorado, New Mexico, and Nevada leading the way in the region.

Data sources

The Land Trust Alliance is the go-to source for information about land trusts. You can download the data from the census they conduct every five years on this page.

Downloads

EcoWest’s mission is to analyze, visualize, and share data on environmental trends in the North American West. Please subscribe to our RSS feed, opt-in for email updates, follow us on Twitter, or like us on Facebook.