Category Archives: Resources

EIA’s portal compares energy sector in 50 states

If you’ve ever been curious about energy facts in your state—such as which sector consumes the most energy, or how your state’s electricity prices compare to the rest of the country—the State Portal hosted by the U.S. Energy Information Administration (EIA) is a convenient, user-friendly resource.

EIA’s portal compares energy in the 50 states from EcoWest on Vimeo.

In a previous EcoWest post, we highlighted another useful data visualization tool, Saxum’s United States of Energy map, which illustrates energy production and known fuel deposits around the country. The EIA web portal offers an interactive tool with state-level energy data and detailed profiles for each state. It also aggregates data on state rankings of energy consumption, production, and prices across sectors and fuel types. Users can create customized energy infrastructure maps, visualize state-level data by generating graphics and charts, and analyze key energy statistics for each state.

In this post, we’ll use the state of Montana as an example to highlight the range of information that the EIA portal provides. From the main landing page, you can select Montana to display the state’s profile overview. Under the “Layers/Legend” menu item, you can choose from over 30 infrastructure layers, including coal plants, hydroelectric plants, natural gas pipelines, transmission lines, and LNG export terminals.

Below are five outputs from the portal that we found especially useful.

1)     State energy rankings

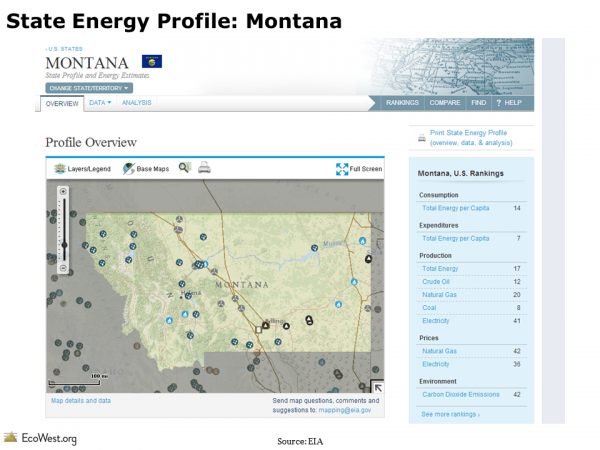
For easy reference, the portal provides a chart on the state profile page to indicate how that state ranks against all other U.S. states in terms of energy consumption, production, pricing, expenditures, and emissions. As you can see from the screenshot below, Montana is the country’s eighth largest producer of coal. The state emits a relatively low level of carbon dioxide, mostly owing to its sparse population.

State Energy Profile: Montana

2)     Energy production by source

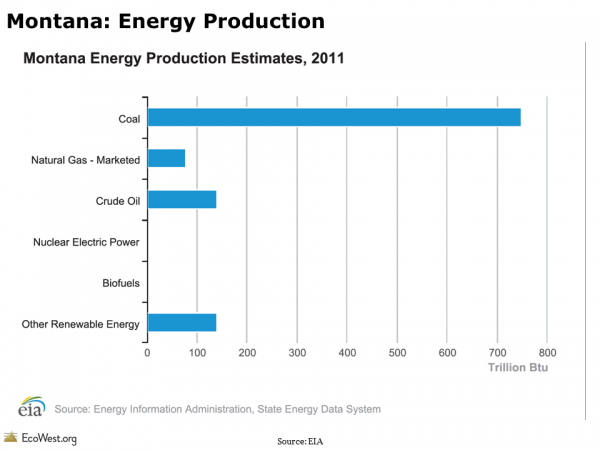
As shown in chart below, coal dominates energy production in Montana. The state is home to the country’s largest estimated recoverable coal reserves. Roughly one-quarter of the coal mined in Montana is consumed in-state for electric power; two-fifths is distributed domestically to more than 15 states; and one-third is exported, mainly to Asia.

Montana: Energy Production

3)    Energy consumption by sector

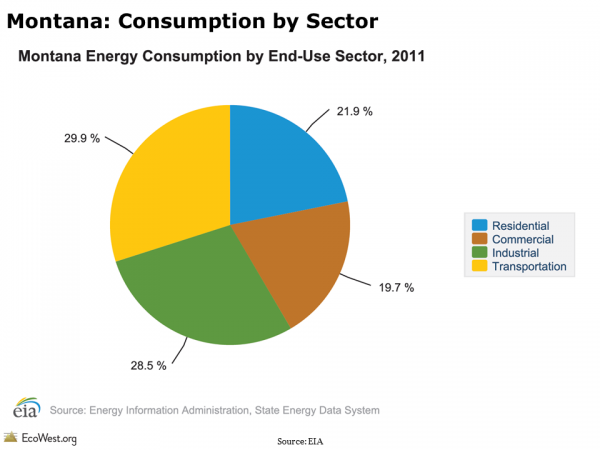
You can also view the breakdown of energy consumption by sector for each state. In Montana, the transportation and industrial sectors account for roughly three-fifths of energy use. At the national level, the industrial and transportation sectors are also the leading energy users.

Montana: Consumption by Sector

4)    State energy prices compared to U.S. average

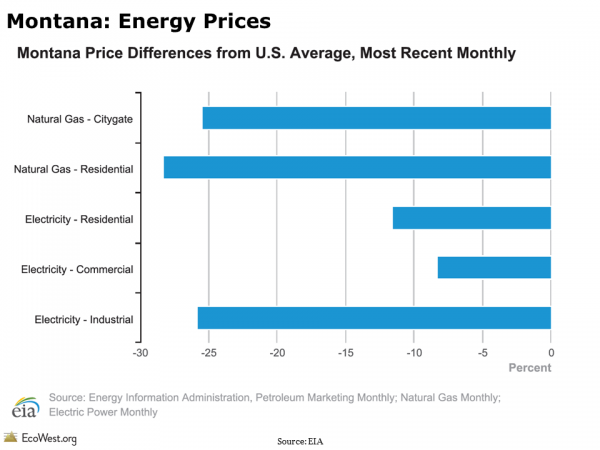
It’s also interesting to compare how energy prices in your state stack up against other states. In Montana, energy prices are about 25 percent lower than the national average. These low prices are primarily a result of a stable supply of energy produced in-state and a relatively low demand from the state’s comparatively small population.

Montana: Energy Prices

5)    Renewable energy potential

Montana is well-situated, geographically speaking, for renewable energy production. The state has significant hydroelectric potential from rivers flowing out of the Rocky Mountains. And across its wide plains, the state has the third highest commercial wind potential in the country.

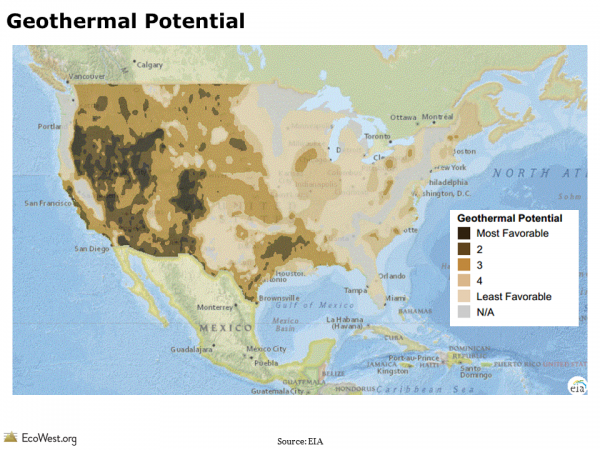
On the EIA state portal, you can map renewable energy potential by source across the country. As this map shows, Montana has significant geothermal potential, particularly in the state’s mountainous southwest corner. Currently, geothermal resources are largely untapped as an electricity source in Montana, a fact which many attribute to the state’s low fossil fuel energy prices, small population, and lack of transmission infrastructure in remote locations.

Geothermal Potential

Given its frequency of updates and user-friendly format, the EIA portal is a handy resource for academics, decision-makers, and residents who are keen to learn more about their state’s energy portfolio. Take a tour of the portal and let us know what you learn about your state.

Data sources

EIA’s state energy portal provides state-level energy data and infrastructure overlays for all 50 U.S. states.

Downloads

EcoWest’s mission is to analyze, visualize, and share data on environmental trends in the North American West. Please subscribe to our RSS feed, opt-in for email updates, follow us on Twitter, or like us on Facebook.

How energy is produced in the American West, the nation’s “energy breadbasket”

The Western Governors’ Association (WGA) calls the West the nation’s “energy breadbasket,” owing to the region’s vast and diverse energy resources. In its most recent report, “The State of Energy in the West,” the WGA provides a comprehensive survey of conventional and renewable energy as part of its year-long focus on energy.

In a previous post, we explored how energy consumption, spending, and prices compare in Western states and across the country. In this post, we shift our focus to the supply side to understand how energy is produced in the West. (Also see our post on the “United States of Energy,” a map that illustrates where the nation’s energy resources are located.)

Energy breadbasket of the U.S.

The West, which the WGA defines as a 19-state region extending as far east as Texas and South Dakota, plays a key role in meeting the country’s energy demands. The WGA dubbed the West the nation’s energy breadbasket for several reasons:

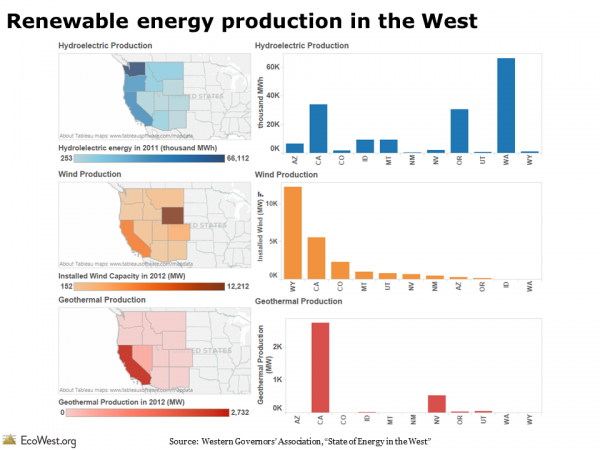
  • The West delivers nearly two-thirds of the nation’s wind energy.
  • California is the national leader in solar energy production, its output nearly triple that of the next highest-producing state (Arizona). Solar energy potential in the Southwest also ranks among the highest in the world.
  • Nearly all of the country’s geothermal resources are located in the West, home to 99.5% of installed national capacity in 2011.
  • In recent years, the West has accounted for close to 70% of the country’s natural gas and petroleum production.
  • Coal production in the West contributes 60% of the national total.

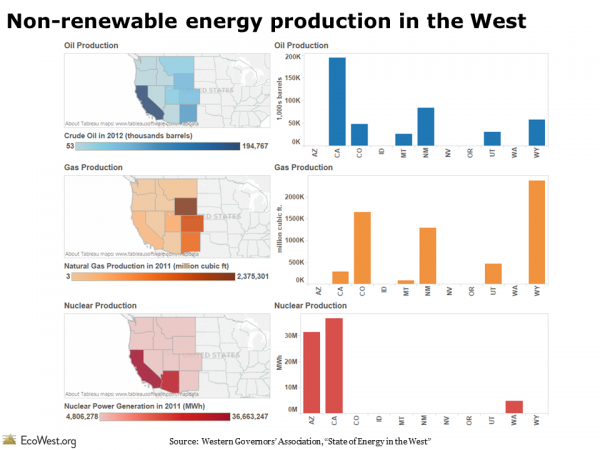
Below is a screenshot (click to enlarge) from our dashboard illustrating energy production in the West, based on 2012 figures.
Non-renewable energy production in the West
Renewable energy production in the West

Energy and the economy

Fossil fuels currently make up the largest share of state-level employment in the West’s energy sector. In 2009, the oil and gas industry accounted for more than 5% of total employment in Alaska, Colorado, Montana, New Mexico, and Wyoming. The coal industry in Wyoming is responsible for 14.2% of the state’s GDP and 8% of its work force in 2010. The state’s total coal output exceeds Russia’s.
Oil and gas as a share of employment, by state
Besides generating jobs, the fossil fuel industry also contributes to the region’s economy through severance taxes, which are applied to the extraction of some non-renewable resources. Five states in the West–Alaska, Colorado, Montana, New Mexico, and Wyoming–have a severance tax endowment, which provides a revenue stream in perpetuity. Among all state-level severance taxes collected across the nation in 2011, roughly 85 % were in the West.

The growing renewable energy industry is also spurring job growth in the region. The wind industry alone has added 30,000 jobs throughout the West and generated over $290 million in property tax revenues.

Energy vision for the West

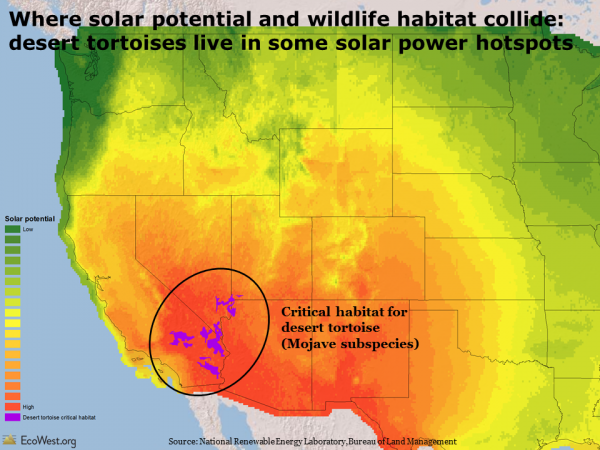
The West’s abundant energy resources play a pivotal role in both the regional and national economy, but energy development also carries environmental costs. Researchers have cautioned that energy sprawl can threaten the habitats of iconic western species, such as the sage grouse and pronghorn. The graphic below, from our land deck, shows the intersection of desert tortoise critical habitat and solar power potential.
Solar energy potential and desert tortoise habitat
As part of its 10-Year Energy Vision, the WGA is working to achieve a balance between responsible energy development and wildlife conservation by engaging in more proactive planning with various stakeholders.

The WGA’s State of the Energy report provides an accessible primer on energy resources in the West, in addition to reviewing topics such as energy efficiency, alternative vehicles/fuels, electricity transmission, and technology development in the sector. Given that the West provides a majority of the nation’s energy supply, the report should be useful for policymakers and residents living in and outside the West.

Data sources

The Western Governors’ Association, a non-partisan organization of 22 U.S. governors, represents 19 U.S. states and 3 U.S. territories. EcoWest typically defines the region as the 11 contiguous Western states, but “The State of Energy in the West” takes a broader view.

Downloads

EcoWest’s mission is to analyze, visualize, and share data on environmental trends in the North American West. Please subscribe to our RSS feed, opt-in for email updates, follow us on Twitter, or like us on Facebook.
Snow jobs: America’s $12 billion winter sports economy and climate change

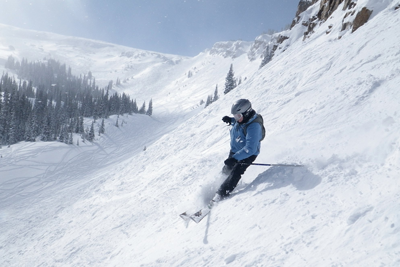
The author at work. Photo by Andy Tarica.

Full disclosure: I love to ski and snowboard, so before reading further, you should know that I’m more of a passionate participant than neutral analyst of America’s snow sports industry.

But whether you’re a ski bum, X Games aspirant, or disinterested flatlander, it’s undeniable that a ton of money is changing hands when it comes to skiing, snowboarding, snowmobiling, and other sports dependent on snow.

In the 2012/2013 season, 8.2 million Americans alpine skied at least once, 7.4 million people snowboarded, and 3.3 million people cross-country skied, for a combined total of nearly 57 million skier-visits. Snowmobiling, which is especially popular in the Upper Midwest, generated more than 7 million visits in just three states combined: Minnesota, Michigan, and Wisconsin.

To cut to the chase: if greenhouse gas emissions continue to climb, climate change is going to endanger America’s winter sports industry. Although a warming atmosphere can hold more water vapor, the precipitation will be more likely to fall as rain than snow, so even parts of the West that get wetter overall could see dramatic reductions in snowfall.

A diminished snowpack will jeopardize water supplies, increase wildfire risks, and transform entire ecosystems. Compared to these impacts, harm to ski bums and resorts may seem trivial, but in economic terms, low-snow years can devastate the tourism that some communities depend on. In the 2009/2010 season, U.S. winter sports trips generated nearly 212,000 jobs, labor income of $7 billion, and total economic value of $12.2 billion.

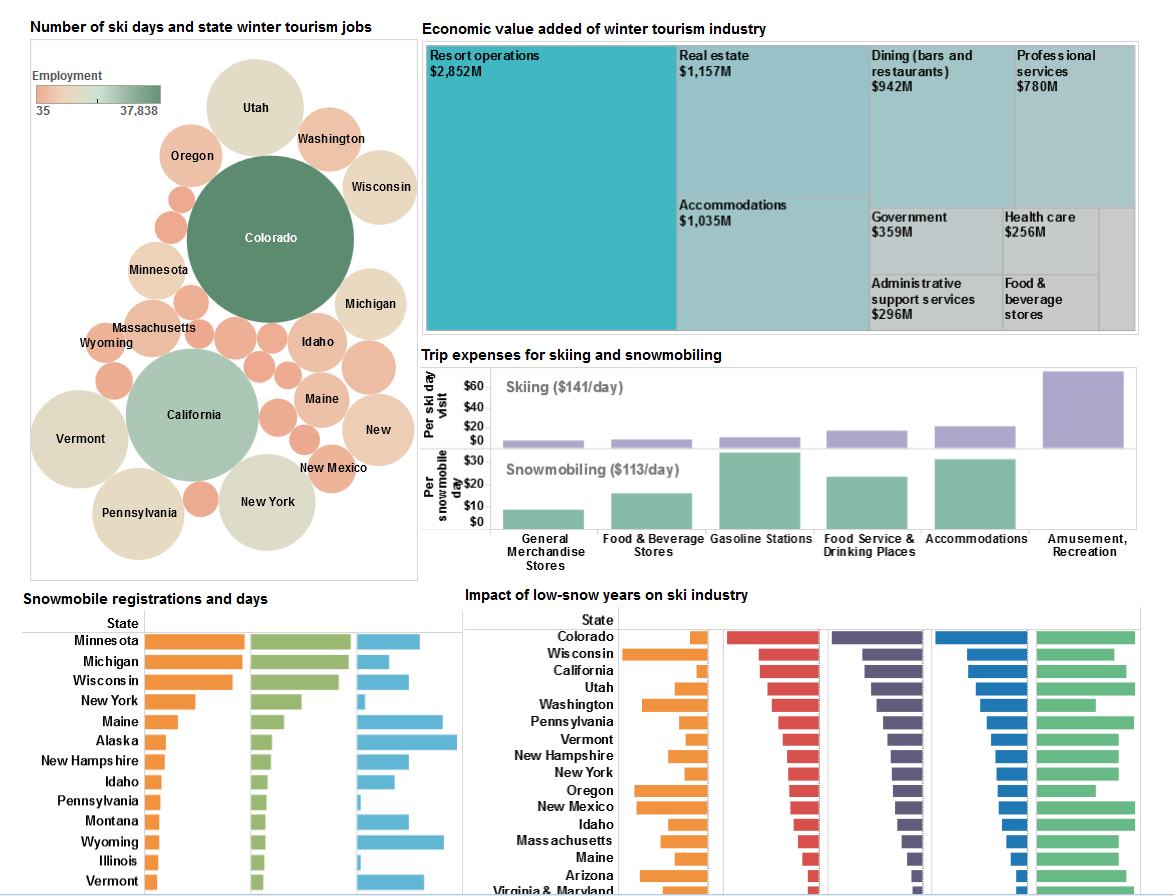
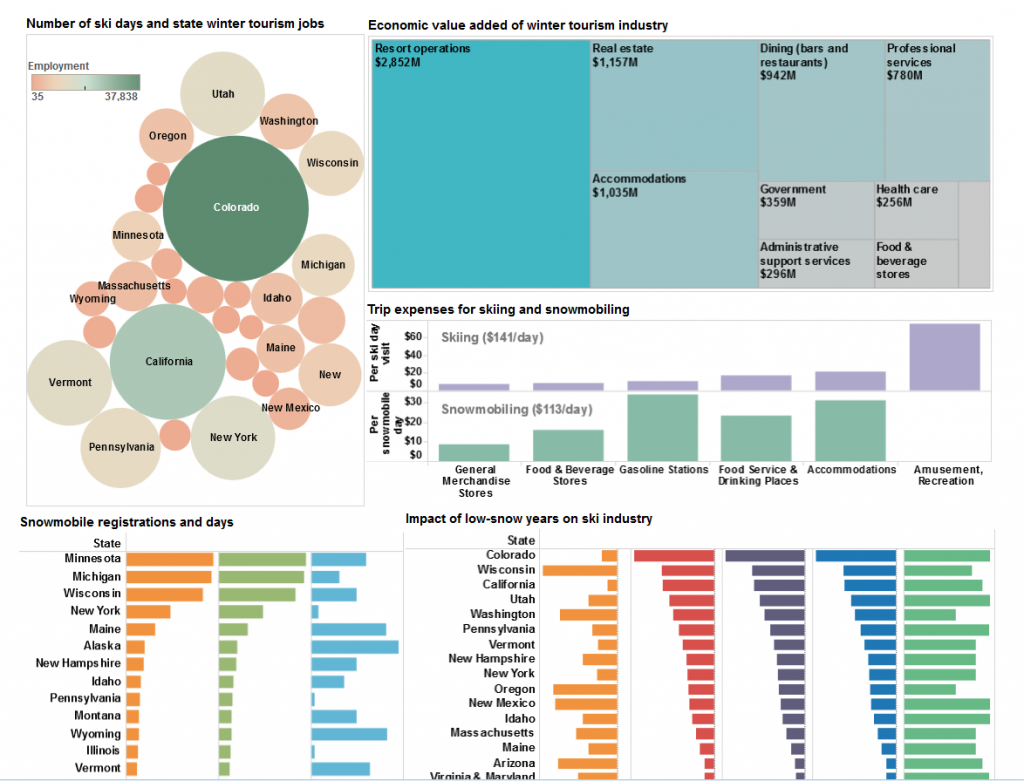
To illustrate what winter sports mean to the U.S. economy, I’ve created a dashboard on this page that visualizes data in a report from two researchers at the University of New Hampshire. Below is a screenshot (click to enlarge).

EcoWest winter sports dashboard

The Natural Resources Defense Council and Protect Our Winters, two advocacy groups, contracted with Elizabeth Burakowski and Matthew Magnusson to examine winter sports tourism in 38 states. The December 2012 report also estimates how much money each state lost, in jobs and economic value, in a low-snow year compared to a high-snow year.

In a future post, we’ll take a closer look at what the science is telling us about trends in the Western snowpack, but the authors of this report paint a bleak portrait of what’s to come under business-as-usual emissions scenarios:

Without intervention, winter temperatures are projected to warm an additional 4 to 10 degrees Fahrenheit by the end of the century, with subsequent decreases in snow cover area, snowfall, and shorter snow season. Snow depths could decline in the west by 25 to 100 percent. The length of the snow season in the northeast will be cut in half.

Yikes. Better seize those powder days while you can. I know I am.

Below is a summary of some visualizations from the dashboard, the original study, and other data sources.

Snow sports widespread

Here in Colorado, winter tourism is a major economic driver, and it’s no shock that we’re tops in the nation for skiing/snowboarding visits. Colorado accounted for one-fifth of ski and snowboarding visits, while one-eighth took place in California. What surprised me was that all but 12 of the 50 states have a winter sports economy (in reporting their findings, the authors did lump together some alpine powerhouses, such as Illinois and Indiana). If you factor in snowmobiling, the winter sports industry has an impressive geographic reach. In the graphic below, the circles are sized by the number of skiing/snowboarding visits and colored according to the number of snowmobiling visits.

Skiing, snowboarding, and snowmobiling days

Data from another source, the National Ski Areas Association, confirms there’s plenty of skiing and snowboarding taking place outside of the West. I grew up skiing/skidding on the icy hills of Northern New Jersey, Vermont, and New Hampshire, and I can definitively state that the skiing out West is way better, but if you look at the number of visits to U.S. resorts, the Rockies and Pacific regions only make up about 55% of the total.

U.S. skier/snowboarder visits by region

Billions at stake in winter tourism

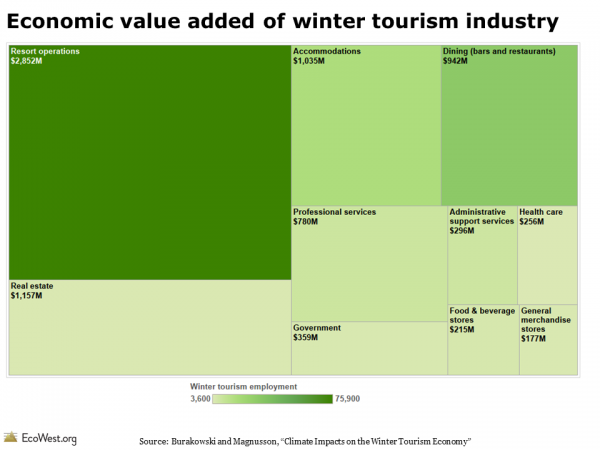
It’s hard not to spend money while skiing and snowboarding, even if you live in Colorado. Before hitting the slopes, I’ll often fuel up my car at the gas station and fill my belly at my local greasy spoon. At the mountain, my annual ski pass helps pay for the parking attendants, lift operators, and ski patrol. Single-day lift ticket prices are north of $100 at some ski areas, which explains why “resort operations” is the biggest box in the graphic below.

Economic value added of winter tourism industryMany ski areas have villages or minor cities at their bases with restaurants, shops, hotels, and spas. Whether it’s the glitterati buying up garish outfits or local yokels like me purchasing coffee for the drive home, money is circulating in the snow-based economy. In mid-February, at Denver International Airport, the wind-chill outside may be 10-below zero, but the baggage claim is a madhouse of travelers arriving from around the globe, ready to shell out big bucks.

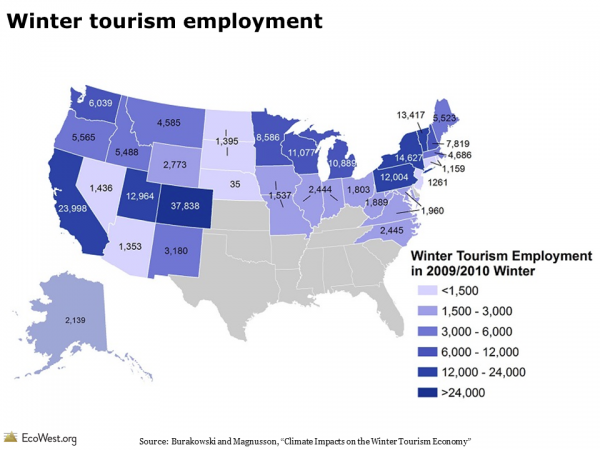
In some cases, entire cities owe their existence to ski areas. Here in Colorado, communities such as Vail, Aspen, Breckenridge, and Telluride are synonymous with their ski mountains. These places see plenty of visitors in spring, summer, and fall. There’s actually some controversy about resorts getting too busy during the “off season.” Even so, winter sports are the magnet for many of these communities, snow is like manna from heaven, and the financial impact of winter sports extends far beyond chic destinations to the more humble places where planes land and tourists drive through. The map below shows that every Western state has more than 1,000 jobs connected to winter sports.

Winter tourism employment

It’s important to remember that the data in our dashboard only tells part of the story. The data focuses on the local economic impact of skiing, snowboarding, and snowmobiling trips. Airline tickets are not included. Nor are the thousands of dollars that people spend on equipment and clothing. Last season, nearly $1.8 billion was spent at snow sports specialty stores on apparel, equipment, and accessories (in roughly equal proportions), according to SnowSports Industries America. Consumers spent about $750 million online on winter sports products.

Low-snow years harm industry

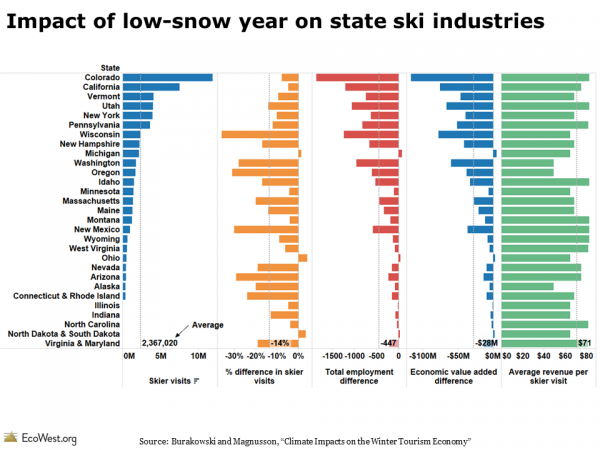
To gauge the impact of climate change, the University of New Hampshire researchers examined what happened to snow sports visits during low-snow years and then estimated the economic hit in the 38 states they studied. As shown below, some states appear to be more resilient than others. Colorado, California, and Utah suffered declines that were less than the national average, but other states, such as Washington, Oregon, and New Hampshire, saw skier visits fall even more than the national average.

Impact of low-snow year on state ski industries

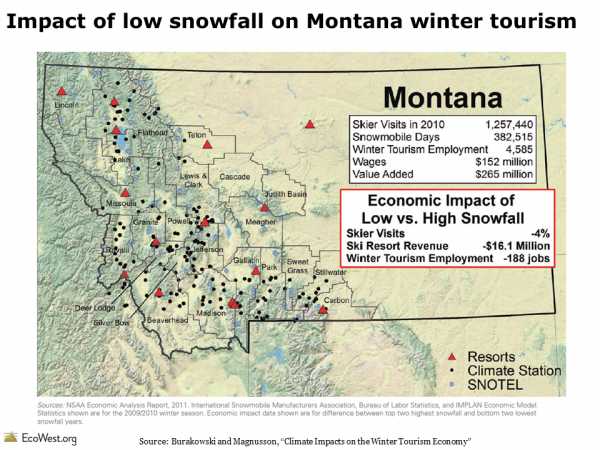
As an example, the graphic below shows that ski resorts in Montana lost $16 million in a low-snow year and winter tourism employment declined by 188 jobs due to the 4% decline in skier visits.

Impact of low snowfall on Montana winter tourism

Industry faces questionable future

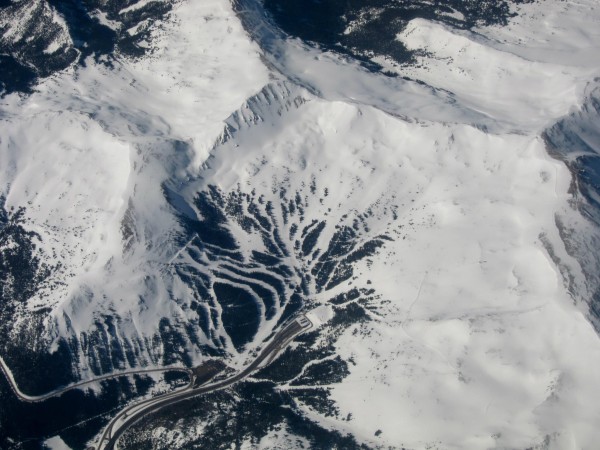
Skiing, snowboarding, and snowmobiling are certainly not without their environmental impacts. Fly west out of Denver on a clear day and you’ll see a lot of clear-cut strips marking the runs at the ski resorts. Below is a photo I snapped of Loveland Ski Area, where I wrote some of this post in between runs.

Loveland Ski Area, Colorado
Loveland Ski Area and Eisenhower Tunnel, Colorado. Photo by Mitch Tobin.

I’ve certainly done my share to cook the planet by driving into the mountains to ski and ride. A 114-mile round trip to Loveland from Denver causes my Subaru Forester to emit around 80 pounds of carbon-dioxide equivalent, according to the EPA’s Greenhouse Gas Emissions Calculator.

But for me and millions of other Americans, playing in the snow is essential to our well-being. We’ll neglect family, friends, work, the health of the planet, and other concerns in order to get our white powder fix. Call it an addiction or healthy habit, snow sports are more than fun and games: they’re also an economic engine that climate change threatens to freeze.

Data sources

Climate Impacts on the Winter Tourism Economy, a report by the Natural Resources Defense Council and Protect Our Winters, is the source for data on jobs, economic value, and snow sports visits in the 38 states.

Data on skiing and snowboarding is also available from Snowsports Industries America and the National Ski Areas Association.

Downloads

EcoWest’s mission is to analyze, visualize, and share data on environmental trends in the North American West. Please subscribe to our RSS feed, opt-in for email updates, follow us on Twitter, or like us on Facebook.