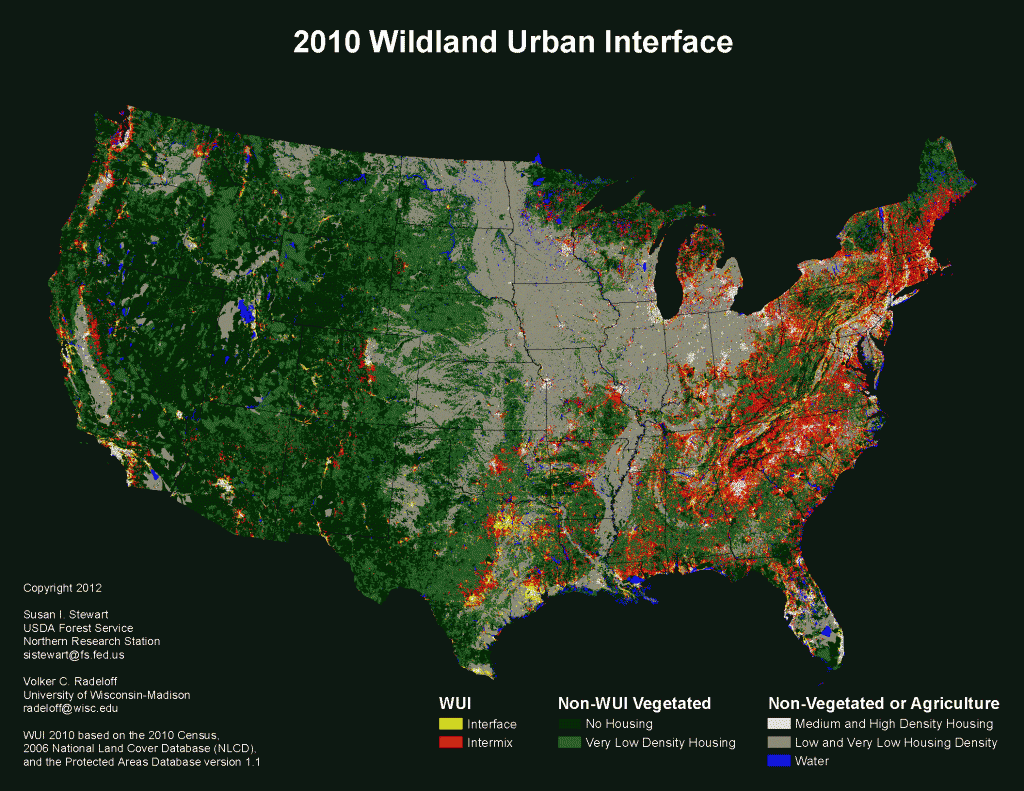
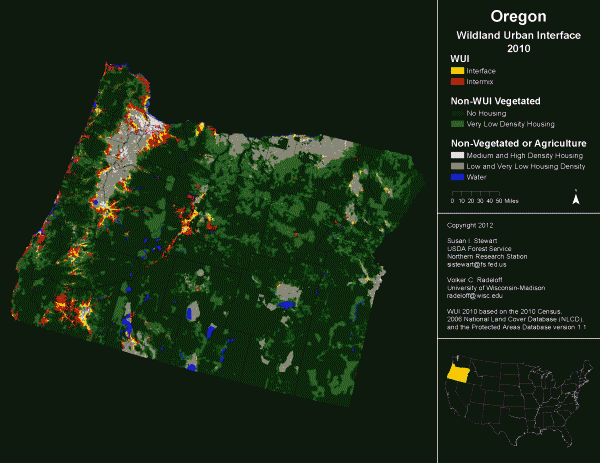
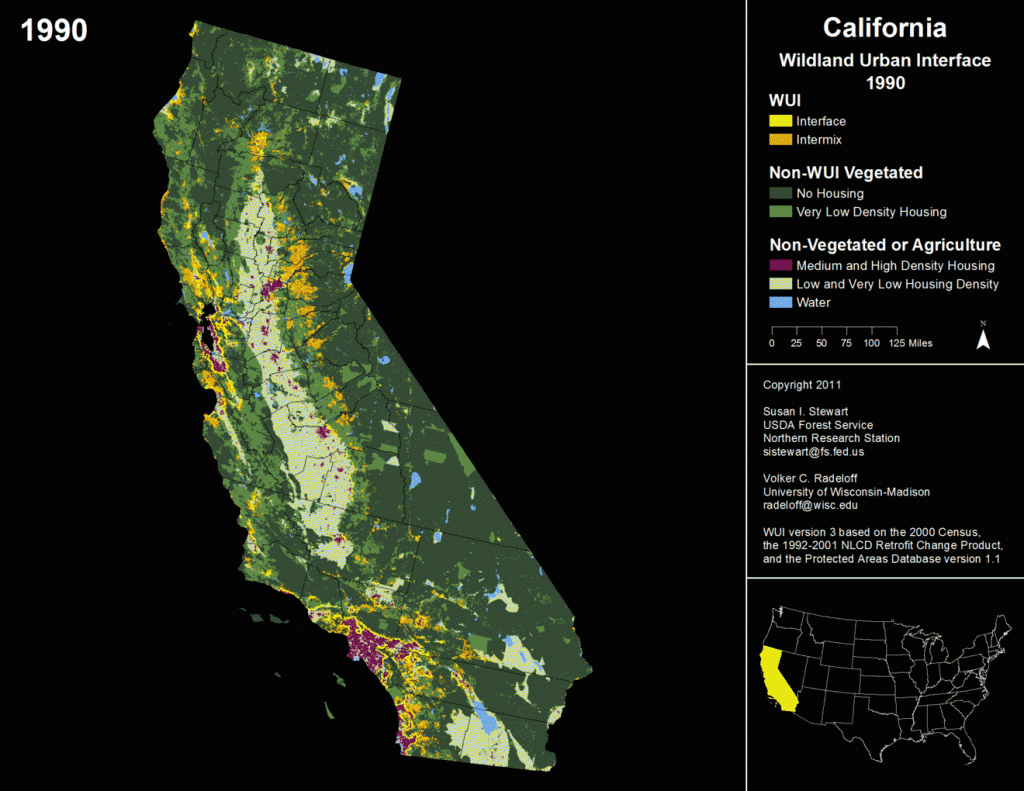
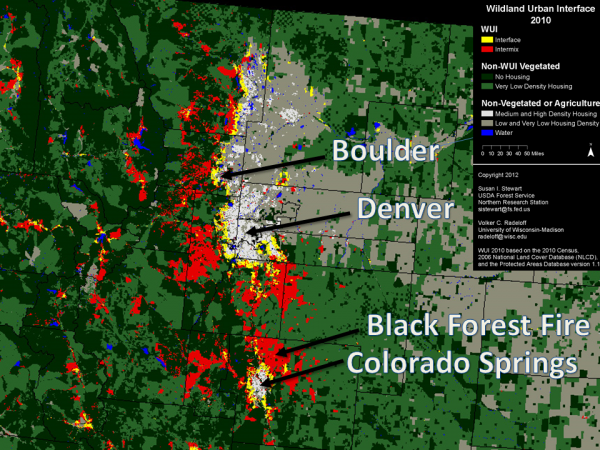
When firefighters are deployed to battle wildfires, they often focus on saving structures in the wildland-urban interface (WUI), where homes mix with or border flammable vegetation.
Where are these vulnerable homes located in the West?
Data from analytics firm CoreLogic provide a good high-level overview of the Western WUI. I’ve created a dashboard on this page to summarize their numbers.
CoreLogic uses four categorizes to describe the risk of wildfires destroying residential properties: very high, high, moderate, and low. There are also categories for agricultural and urban properties, which are not rated for their fire danger.
In the 13 Western states it analyzed, CoreLogic found some 740,000 residences at high or very high risk for wildfire damage and those homes are valued at more than $136 billion. Nearly 168,000 homes, valued at more than $32 billion, are in the very high risk category.
Geographic disparities
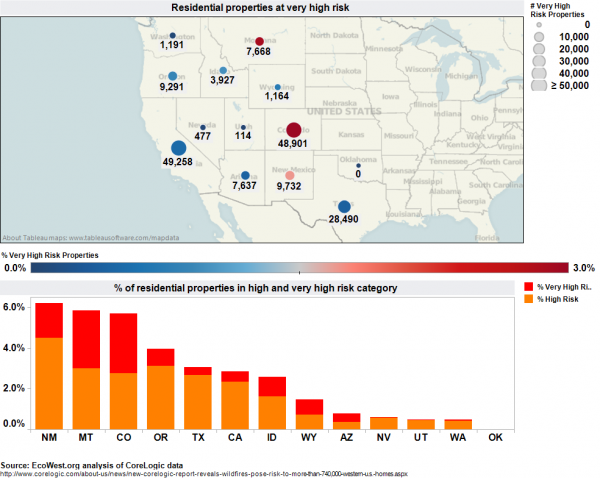
Below are a couple of views of the data (click to enlarge). The map shows the number of homes in the very high risk category, with the circles colored by the percent of homes in each state that are in this most vulnerable category. You can see that California and Colorado both have nearly 50,000 homes in this category, but while that’s about 3 percent of Colorado’s residential properties, it’s just 0.5 percent of California’s. The bar chart shows what percent of each state’s homes are in the very high and high categories.
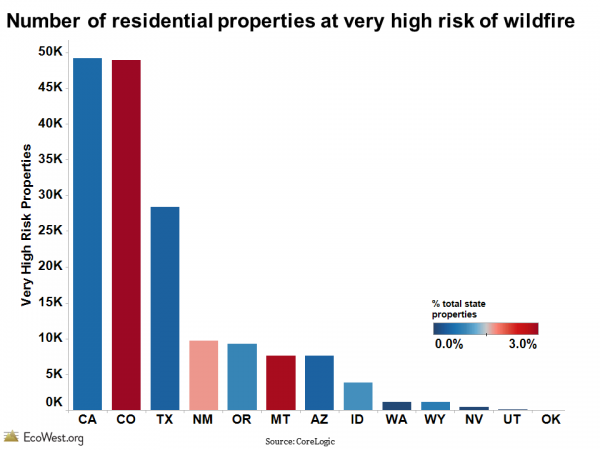
New Mexico, Montana, and Colorado have the highest percentages of homes in the top-two risk categories. Below is another visualization of the data, which just focuses on the very high risk category.
Comparing average home values
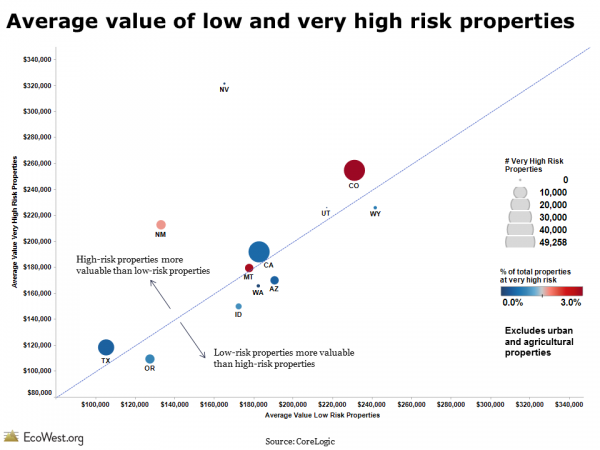
CoreLogic also provides data on the value of the residential properties in each of the risk categories. I divided these values by the number of homes in each category to create an average value figure, which is presented below in a scatter plot.
In this graphic, I’m comparing the very high risk to the low risk homes. The circles vary in size by the number of homes in the very high risk category and they’re colored to show the percent of homes in a state that are in this most vulnerable subset. If a state is above the 45-degree line, its very high risk properties are more valuable, on average, than the low risk homes, and vice versa.
This scatter plot shows that in plenty of Western states, homes in the riskiest and least risky categorize have roughly the same average value (they fall on or close to the 45-degree line). But in Nevada, the very high risk homes have an average value of about $325,000, while the lowest risk houses have an average value of about $165,000. The spread of the circles also indicates that there’s great state-to-state variation in home values. Colorado’s very high risk properties, for example, are more than twice as valuable as those in Texas.
CoreLogic sells much more detailed information on risk to insurance companies, but these state-level figures still show some interesting geographic patterns. California, Colorado, and Texas have the most homes in the WUI, while Washington, Wyoming, Nevada, Utah, and Oklahoma have very few.
Here’s more from CoreLogic and Dr. Howard Botts, its vice president and director of database development:
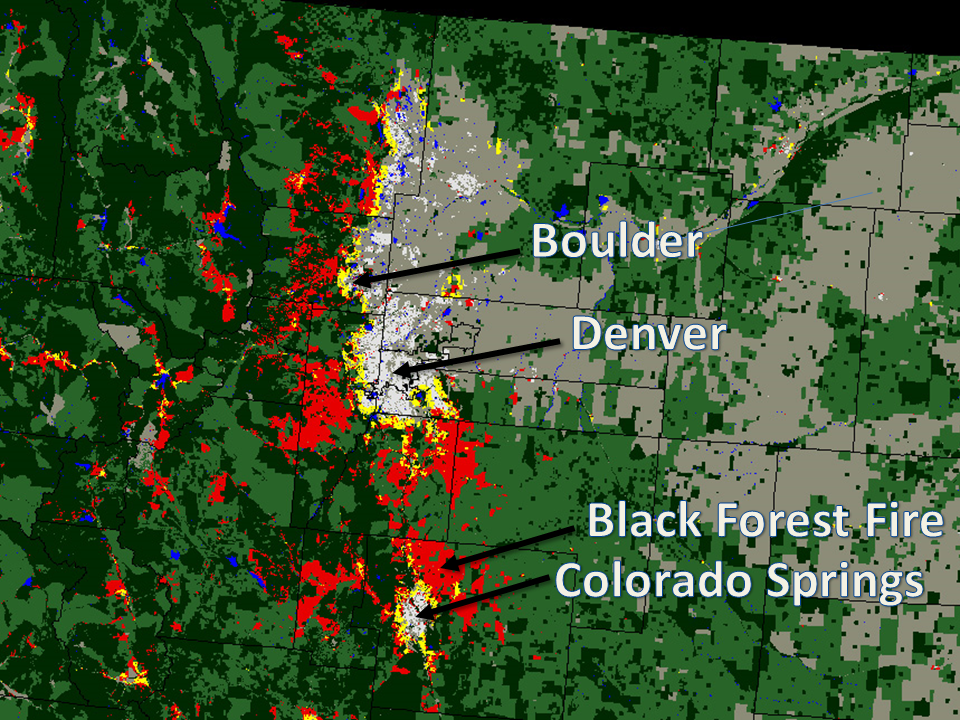
The Wildland Urban Interface (WUI) identifies the intersection of potentially high-risk fire areas and large numbers of homes. The report states that just between the years of 1990 to 2008, there were close to 17 million new homes built in the U.S., of which 10 million (58 percent) were located in the WUI and therefore potentially located near high wildfire risk zones. “Homes located within a city boundary are not safe from the threat of wildfire destruction. In fact, the unprecedented growth of urban areas over the past 50 years has generally increased the likelihood homes will be damaged by wildfire activity,” said Botts. “As residential development has expanded into formerly undeveloped wildlands, the transitional area between the two, known as the Wildfire Urban Interface, has become exceptionally vulnerable to wildfire. Approximately 40 percent of homes in the U.S. are located in that zone, and wind-blown embers are capable of igniting homes located hundreds, or even thousands of feet away from an actual fire.”
I’d be curious if readers see any other patterns in the data, which is available for download below. We have a gallery of state-by-state WUI maps and some more discussion of the issue in this post.
NOTE: I’m about to head off on vacation, so EcoWest will resume with new posts the week of July 15.
Downloads
- Download Slides: CoreLogic WUI Homes (5962 downloads )
- Download Data: CoreLogic WUI Homes (5210 downloads )
EcoWest’s mission is to analyze, visualize, and share data on environmental trends in the North American West. Please subscribe to our RSS feed, opt-in for email updates, follow us on Twitter, or like us on Facebook.

