

With drought gripping much of the West, 2013 could be another active wildfire season in the region. There’s already a fast-moving blaze in Southern California that is threatening hundreds of homes.
To track the severity of wildfires, I’ve created a dashboard on this page that summarizes recent trends, both nationally and in the West.
The screenshot below (click to enlarge) shows how the number of fires, acres burned, and average size of fires has changed since 1987. While the number of fires has remained relatively constant, the acreage burned and average size have been exhibiting an upward trend.
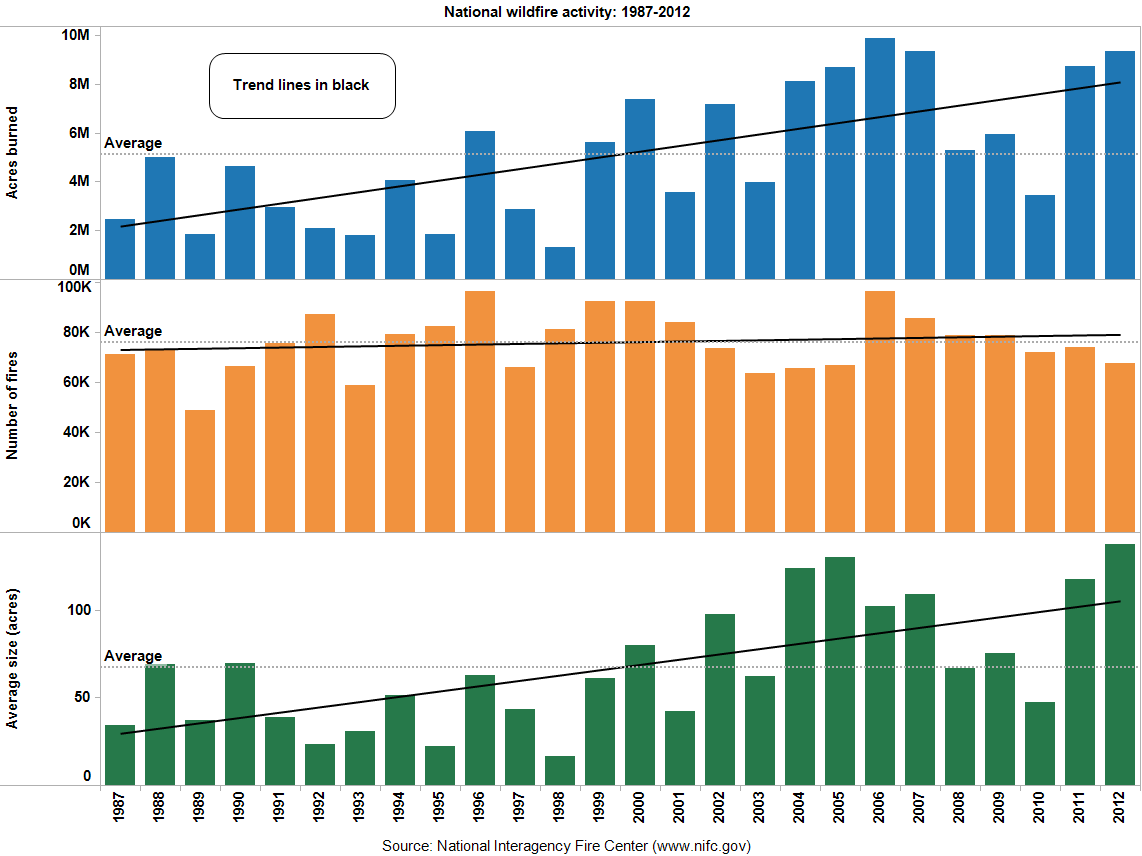
In our wildfire PowerPoint deck, we explain why Western wildfires are generally getting bigger and more destructive. Although fire is a natural part of many Western forests, woodlands, and grasslands, we’re now suffering from the legacy of misguided fire suppression in ecosystems where frequent, low-intensity blazes once consumed excess fuel. A 2006 paper in Science, which found that “large wildfire activity increased suddenly and markedly in the mid-1980s,” argued that warming temperatures and an earlier spring snowmelt were the biggest drivers.
If you examine the yearly statistics, however, you’ll see that wildfire activity varies greatly from season to season. A couple of enormous blazes can really skew the national totals, while in some years benign weather keeps a damper on wildfires. You can see that variability even more clearly by just looking at the Western states in this screen shot below (click to enlarge).
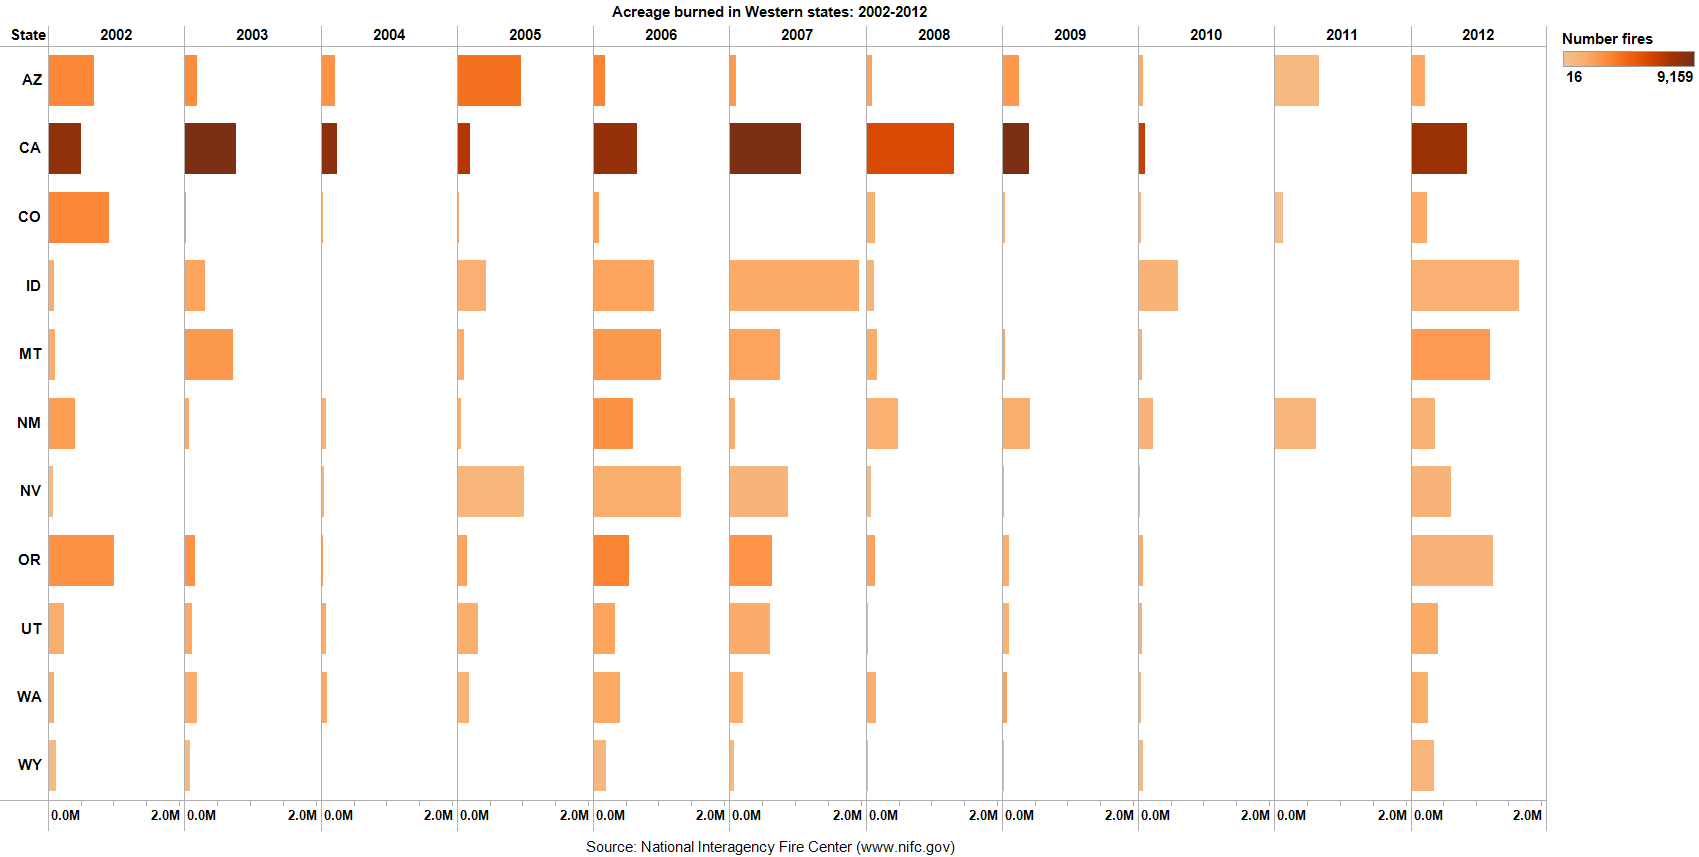
In Idaho, for example, very few acres burned in 2004, but 2007 was especially active. Some years, such as 2004 and 2010, were relatively tame across the entire West. In others, certain regions were especially hard hit, such as Arizona and New Mexico in 2011. But then at other times, such as 2012, nearly all states reported lots of acres burned.
The dashboard also allows you to examine wildfire activity by different regions. With all of the graphics, you can include/exclude variables, sort the data, and create downloadable images and PDFs.
I’ve used this same data to create some PowerPoint slides, which are available in this video below and through download links at the bottom of the post.
Tracking trends in wildfire activity from EcoWest on Vimeo.
In the coming weeks, I’ll be rolling out more slides and dashboards for monitoring the wildfire issue, including ignition sources, fuels treatment, and wildfire suppression.
Data sources
Compared to other issues, I’ve found that tracking wildfires is relatively straightforward. Almost all of the key data is managed by the National Interagency Fire Center in Boise, Idaho. During the fire season, NIFC provides detailed information on blazes in progress, but the center also compiles statistics and produces an annual report that summarizes the preceding year. Here’s the 2012 summary, for example.
Downloads
- Download slides: trends in recent wildfire activity (2134 downloads )
- Download notes: trends in recent wildfire activity (2505 downloads )
- Download data: trends in recent wildfire activity (2017 downloads )
EcoWest’s mission is to analyze, visualize, and share data on environmental trends in the North American West. Please subscribe to our RSS feed, opt-in for email updates, follow us on Twitter, or like us on Facebook.
2 thoughts on “Tracking trends in recent wildfire activity”
Comments are closed.