The elevations of Lake Powell and Lake Mead, two critical reservoirs on the Colorado River, are like the Dow and S&P 500 for water in the Southwest. These closely watched metrics serve as simple barometers and summaries of how things are going in a fiendishly complex system, be it the U.S. economy or a watershed spread across a quarter-million square miles that provides drinking water for nearly 40 million people.
“Water buffaloes,” the professionals who manage the West’s most precious resource, have been sounding bearish in recent days about Powell and Mead, the nation’s two largest reservoirs by capacity. The past 14 years have been the driest for the Colorado River in more than a century of record keeping. On Friday, federal officials announced they will cut releases from Powell from 8.23 million acre-feet to 7.48 million acre-feet, which would be lowest release since the reservoir was filling in the 1960s.
To track water storage in Powell and Mead, I’ve created a dashboard that plots the lake levels and some important benchmarks. Below are some images from the visualization (click to enlarge). There’s also a PowerPoint presentation you can download at the bottom of the post.
Elevation benchmarks
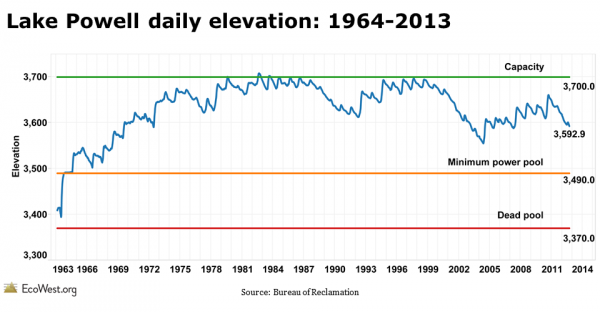
The Powell chart plots the daily elevation and the Mead chart illustrates the July 1 level; in the former, you can see the annual ebb and flow. I used two different time scales because that’s how I found the data on the U.S. Bureau of Reclamation’s websites (separate offices manage Powell and Mead).
Capacity shows the elevation when the reservoirs are full. For Powell, raising the spillway gates can slightly increase capacity, but flooding in 1983 did nearly overtop Glen Canyon Dam. When a reservoir is at dead pool, the water level is so low that it cannot drain by gravity through the dam’s outlet works. Hydropower can only be generated when the reservoir is above the minimum power pool. For Mead, which supplies the Las Vegas metro area, the elevation of the Southern Nevada Water Authority’s lower intake is shown.
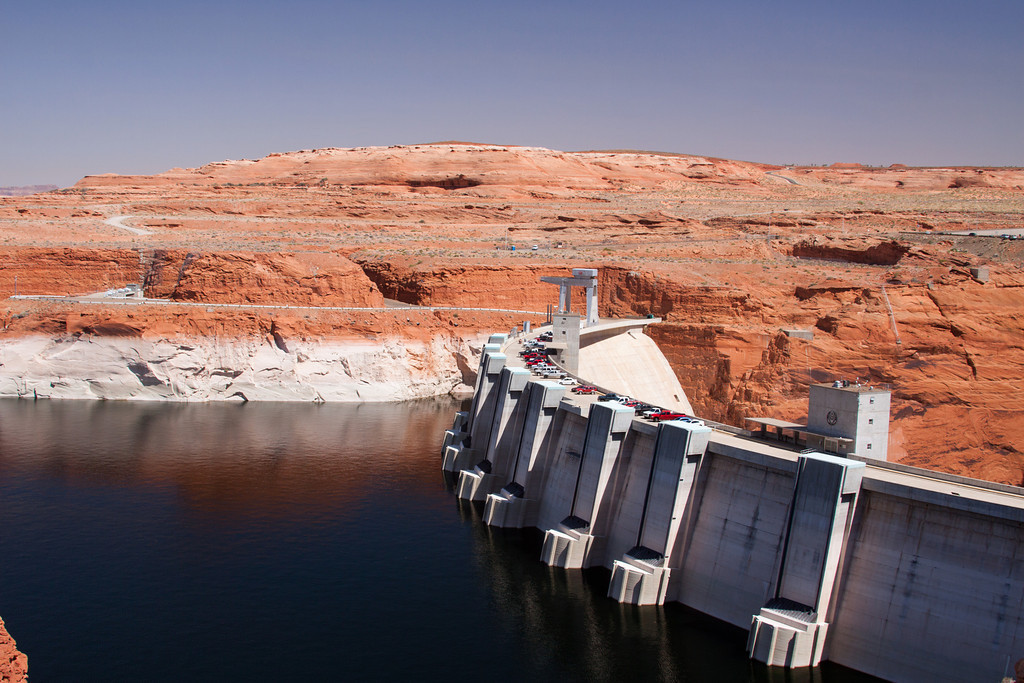
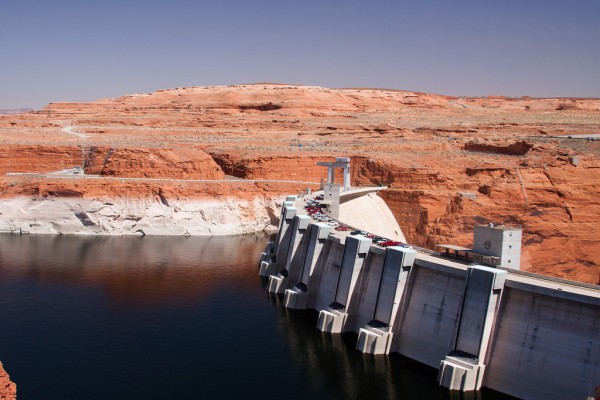
Our dashboard uses lake elevation, but in our PowerPoint deck we also have some slides showing changes in volume. Each metric tells us different things about the status of the reservoirs, but elevation is easier to visualize. Below is a photo I took last April of Powell’s so-called bathtub ring, which is even more exposed today.
Satellite imagery shows Powell’s decline
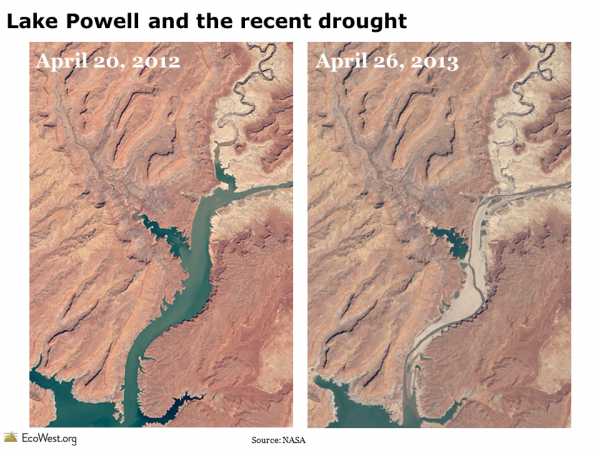
Another way to track the status of these reservoirs is by taking repeat photographs, either on Earth or from space, of the same location. Below are two views of Lake Powell, the first showing 2002 vs. 2003, and the second comparing 2012 vs. 2013, based on NASA satellite imagery.
The PowerPoint deck that you can download below contains a time series of satellite images of Powell from 1999 to 2013. The contrast between 2012 and 2013 illustrates why federal officials are taking action and cutting releases from the reservoir.
Reservoir levels projected to fall
Looking ahead, federal water managers project that Mead will drop another eight feet in 2014 due to reduced releases from Powell. Below is a graphic from Reclamation that shows Powell is likely to keep falling as well.
Basin susceptible to megadroughts
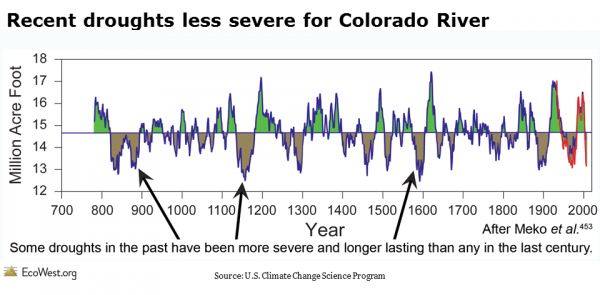
The outlook for precipitation in the basin over the next few years is uncertain, but one thing we know for sure is that the Colorado River is vulnerable to megadroughts, the likes of which we haven’t seen in modern times. The graphic below, from the U.S. Climate Change Science Program, shows the annual flow of the Colorado River over the past 1,200 years. Scientists used tree rings to estimate the river’s volume before the instrumental record, which is shown as a red line. The arrows point out that the basin has been periodically hit with megadroughts that were worse than the one we’ve been experiencing since 2000.
Climate change expected to shrink Colorado’s flow
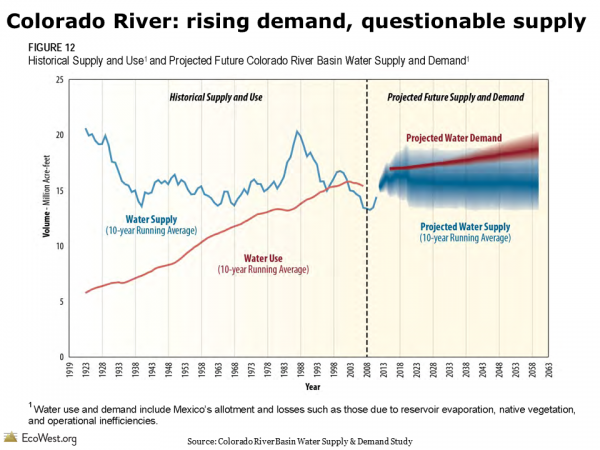
Even without considering climate change, the Colorado River would face a challenging future because the demand for its limited–and capricious–supply is increasing along with the Southwest’s population. But scientists project that even less water will flow down the river in the decades to come due to rising temperatures and altered precipitation patterns. The graphic below, from Reclamation’s recent Basin Study, shows that demand is projected to exceed supply on the river (see our earlier post for more details).
Data sources
The Bureau of Reclamation provides detailed data on Lake Powell and Lake Mead. I pulled the benchmark levels from this Reclamation presentation, specifically page 15.
If you’re keeping score at home, the capacity of elevation of Powell is listed as 3,700 feet, but during floods the reservoir’s elevation can go slightly above this level by raising the spillway gates. In 1983, Powell reached an all-time high elevation of 3,708.34 feet.
The decision to cut releases from Powell was covered by The Arizona Republic, National Public Radio, and The Salt Lake Tribune, among others.
Downloads
- Download Slides: Lake Powell and Lake Mead (7658 downloads )
- Download Notes: Lake Powell and Lake Mead (8428 downloads )
EcoWest’s mission is to analyze, visualize, and share data on environmental trends in the North American West. Please subscribe to our RSS feed, opt-in for email updates, follow us on Twitter, or like us on Facebook.

