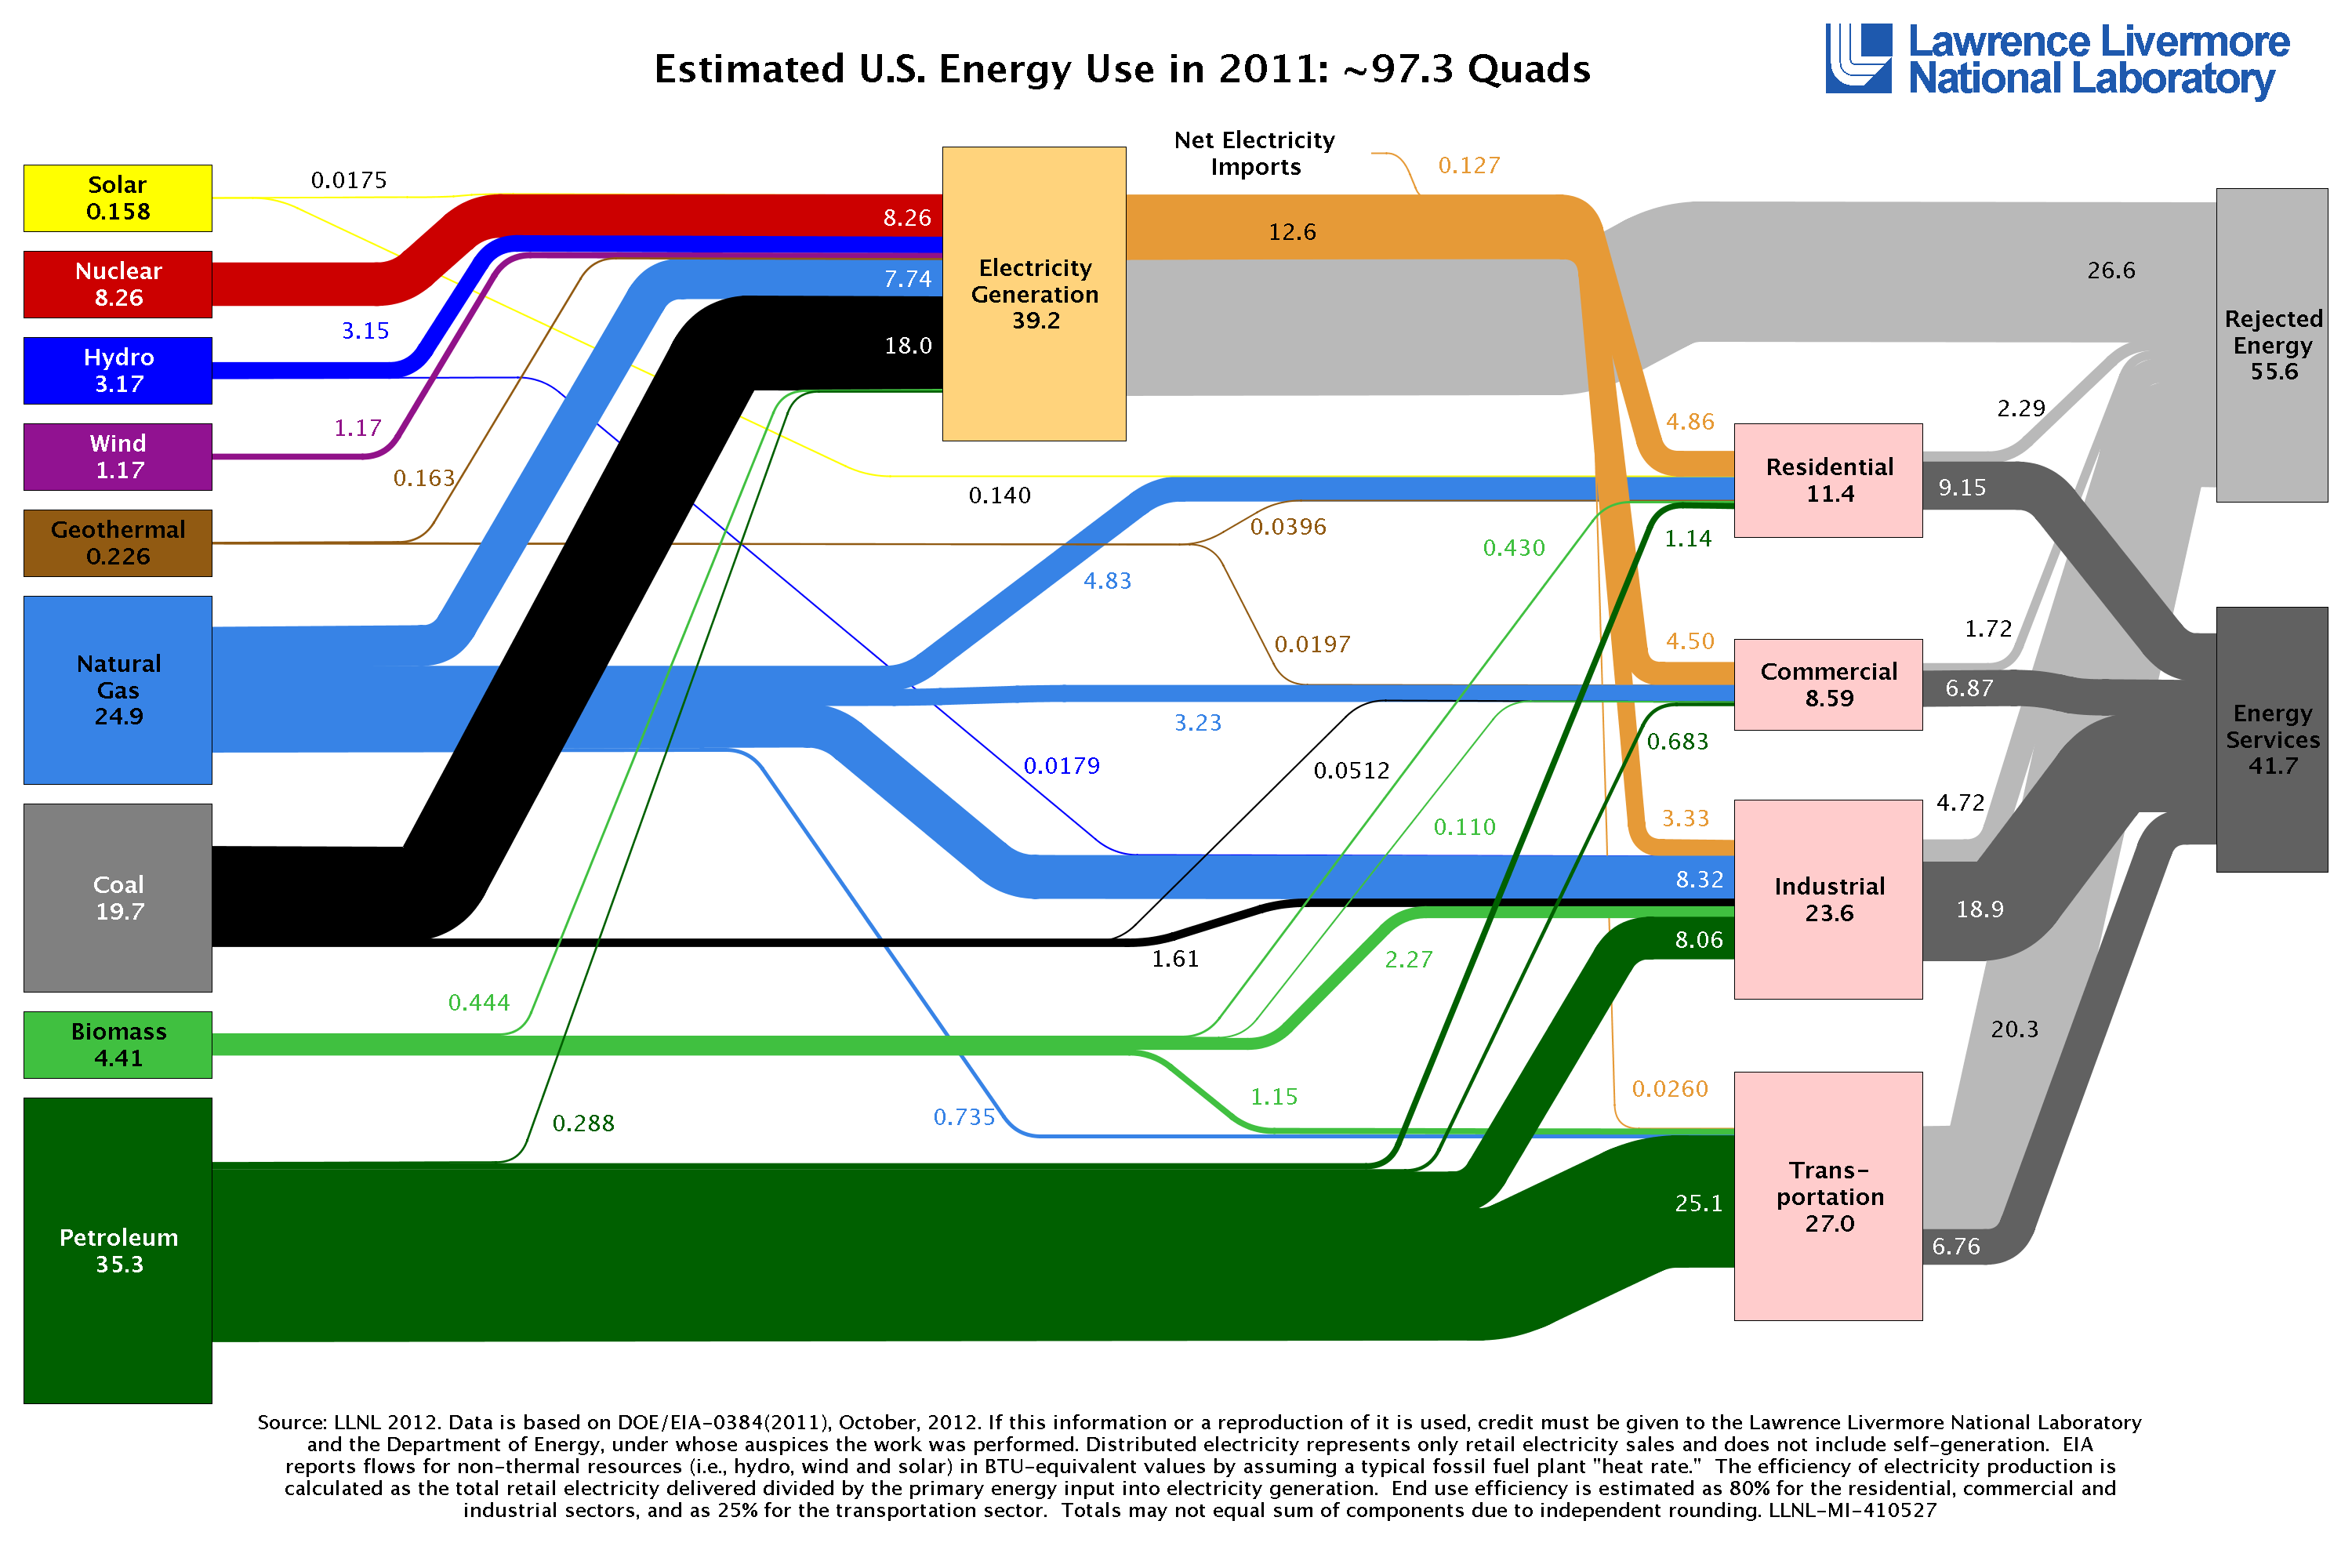
Energy flows through everything, so it’s only fitting to use flow charts to depict our complex energy economy.
Since the early 1970s, the Lawrence Livermore National Laboratory has been producing such graphics, not only for energy, but also for water and carbon dioxide. Technically known as Sankey diagrams, these data visualizations summarize flows through a system by varying the width of lines according to the magnitude of the commodity in question.
In this deck of slides, I offer up some of Sankey diagrams that illustrate energy trends in the United States and Western states. Looking at these visualizations over time shows that fossil fuels continue to dominate the nation’s energy mix, but renewable sources are making some headway. In the West, some inland states rely almost exclusively on coal to generate electricity, but other states use significant quantities of natural gas, wind, and nuclear power. Overall, petroleum in the transportation sector accounts for the greatest share of our energy flows.
History of diagram
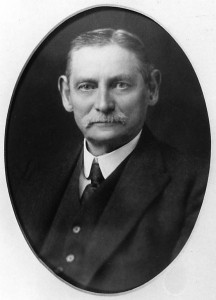
Sankey diagrams are named after Matthew Henry Phineas Riall Sankey, an Irish Captain who used the graphic in a 1898 publication on steam engines. Since then, Sankey’s diagrams have won a dedicated following among data visualization nerds. There’s even an entire blog devoted to the graphic, which boasts in its tagline that “a Sankey diagram says more than 1,000 pie charts.” The blog has a good overview of software tools that create Sankey diagrams here.
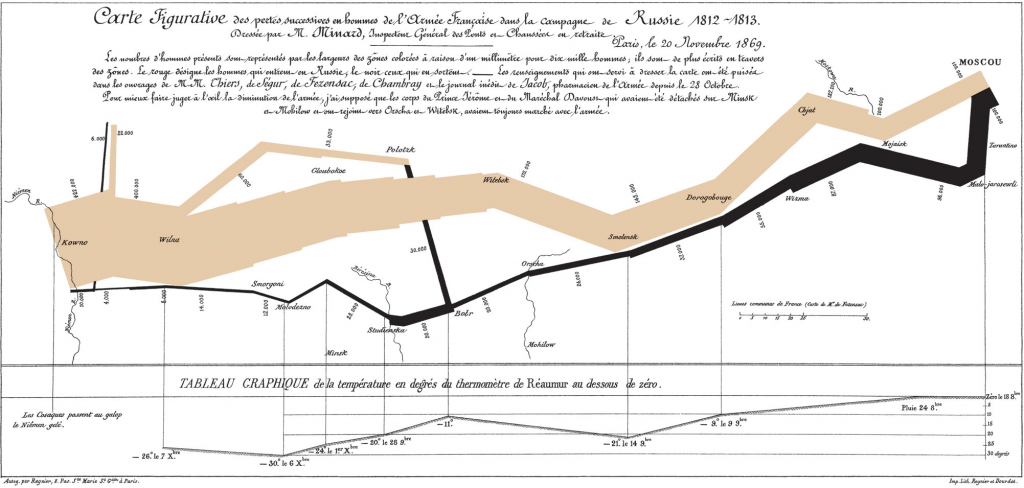
One of the earliest and most famous examples of the form illustrates Napoleon’s disastrous Russian campaign in the early 19th century. Created by Charles Joseph Minard, a French civil engineer, the graphic (technically, a flow map) depicts the army’s movement across Europe and shows how their ranks were reduced from 422,000 troops in June 1812, when they invaded Russia, to just 10,000, when the remnants of the force staggered back into Poland after retreating through a brutal winter.
Data visualization guru Edward Tufte, whose undergraduate political science class helped get me interested in graphics and data analysis more than two decades ago, calls it “probably the best statistical graphic ever drawn.” Besides showing the declining troop totals, the graphic details the army’s location and direction over time, as well as the temperature.
Significant shifts in energy flows
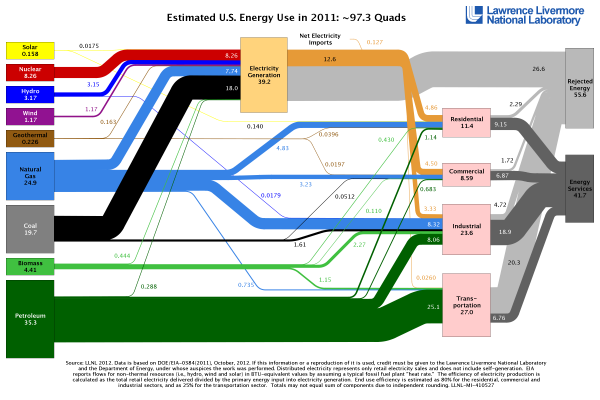
LLNL’s latest energy diagram, released in October 2012, depicts 2011 data and illustrates some major changes in the nation’s energy sector. As the lab noted in its press release, “Americans used less energy in 2011 than in the previous year due mainly to a shift to higher-efficiency energy technologies in the transportation and residential sectors.”
The largest increase in energy production was in the wind sector; hydropower also grew due to a wet winter in the West. Even so, the nation’s energy flows are still dominated by coal, natural gas, and petroleum. “Sustained low natural gas prices have prompted a shift from coal to gas in the electricity generating sector,” said A.J. Simon, an energy systems analyst at the lab. “Sustained high oil prices have likely driven the decline in oil use over the past 5 years as people choose to drive less and purchase automobiles that get more miles per gallon.”
Energy use varies widely in West
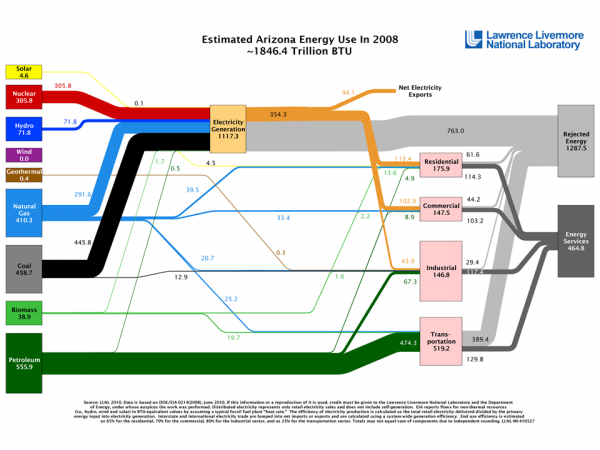
Among Western states, the Sankey diagrams show some clear patterns. States like Wyoming, Colorado, New Mexico, Montana, and Utah rely heavily on coal for their electricity production, in some cases exporting that power to other states. Coal may be king for electricity generation in many states in the intermountain West, but it’s hydropower that dominates power portfolios in the Pacific Northwest: Washington, Oregon, and Idaho get the bulk of their electricity from dams. Other states have more diversified portfolios; Arizona, shown below, relies on a mix of coal (40%), nuclear (27%), natural gas (26%), and hydropower (6%). But not much solar for a pretty sunny state.
In all of the energy diagrams, you’ll notice that a significant share of energy is “rejected.” A good example of rejected energy is waste heat from power plants. The greater the percentage of rejected energy, the less efficient the system. It’s worth noting that the state-level data is from 2008, three years older that the national data, and the U.S. energy economy has undergone some major shifts since then, including a shift from coal to natural gas and growing competitiveness of wind power.
Long-standing data source
The Lawrence Livermore National Laboratory has published flow charts of energy, water, and carbon dioxide since the early 1970s, sometimes going down to the level of individual states. Here’s how the lab describes the graphics and their creation:
Flow charts are valuable as single‐page references that contain quantitative data about resource, commodity and byproduct flows in a graphical form that also conveys structural information about the system that manages those flows. Recent advances in the automation of Sankey Diagram generation have made it possible to produce a consistent set of state‐level energy flowcharts. A computer program reads SEDS [State Energy Data System] data, performs a set of calculations and re‐sizes and re‐labels the flows in the figure. Human interaction is required only to reconcile instances where graphical elements overlap.
Other versions
The U.S. Department of Energy’s Office of Science offers similar diagrams, including one that embeds some interesting factoids and imagery. I’ve included them in the deck as well. Here’s how the agency summarizes its flow graphics:
Oil provided the largest share of the 98 quads of primary energy consumed, and most of it was used for transportation. Consumption of natural gas, the nation’s second largest energy source, is split three ways—electricity generation, industrial processing, and residential and commercial uses (mostly for heating). Coal, our third largest source, is used almost exclusively for electricity. Nuclear energy and renewables each meet less than 10% of U.S. energy demand.
The International Energy Agency has also produced a poster-sized Sankey diagram depicting world energy flows (there’s a PDF available, but the text is microscopic).
In a future post, I’ll take a closer look at Sankey diagrams that visualize water flows. In the meantime, I’d be curious to hear what others think about these graphical tools and any insights they reveal about the energy challenges we face.
Downloads
- Download Slides: Sankey Energy Diagrams (6045 downloads )
- Download Notes: Sankey Energy Diagrams (6751 downloads )
EcoWest’s mission is to analyze, visualize, and share data on environmental trends in the North American West. Please subscribe to our RSS feed, opt-in for email updates, follow us on Twitter, or like us on Facebook.

