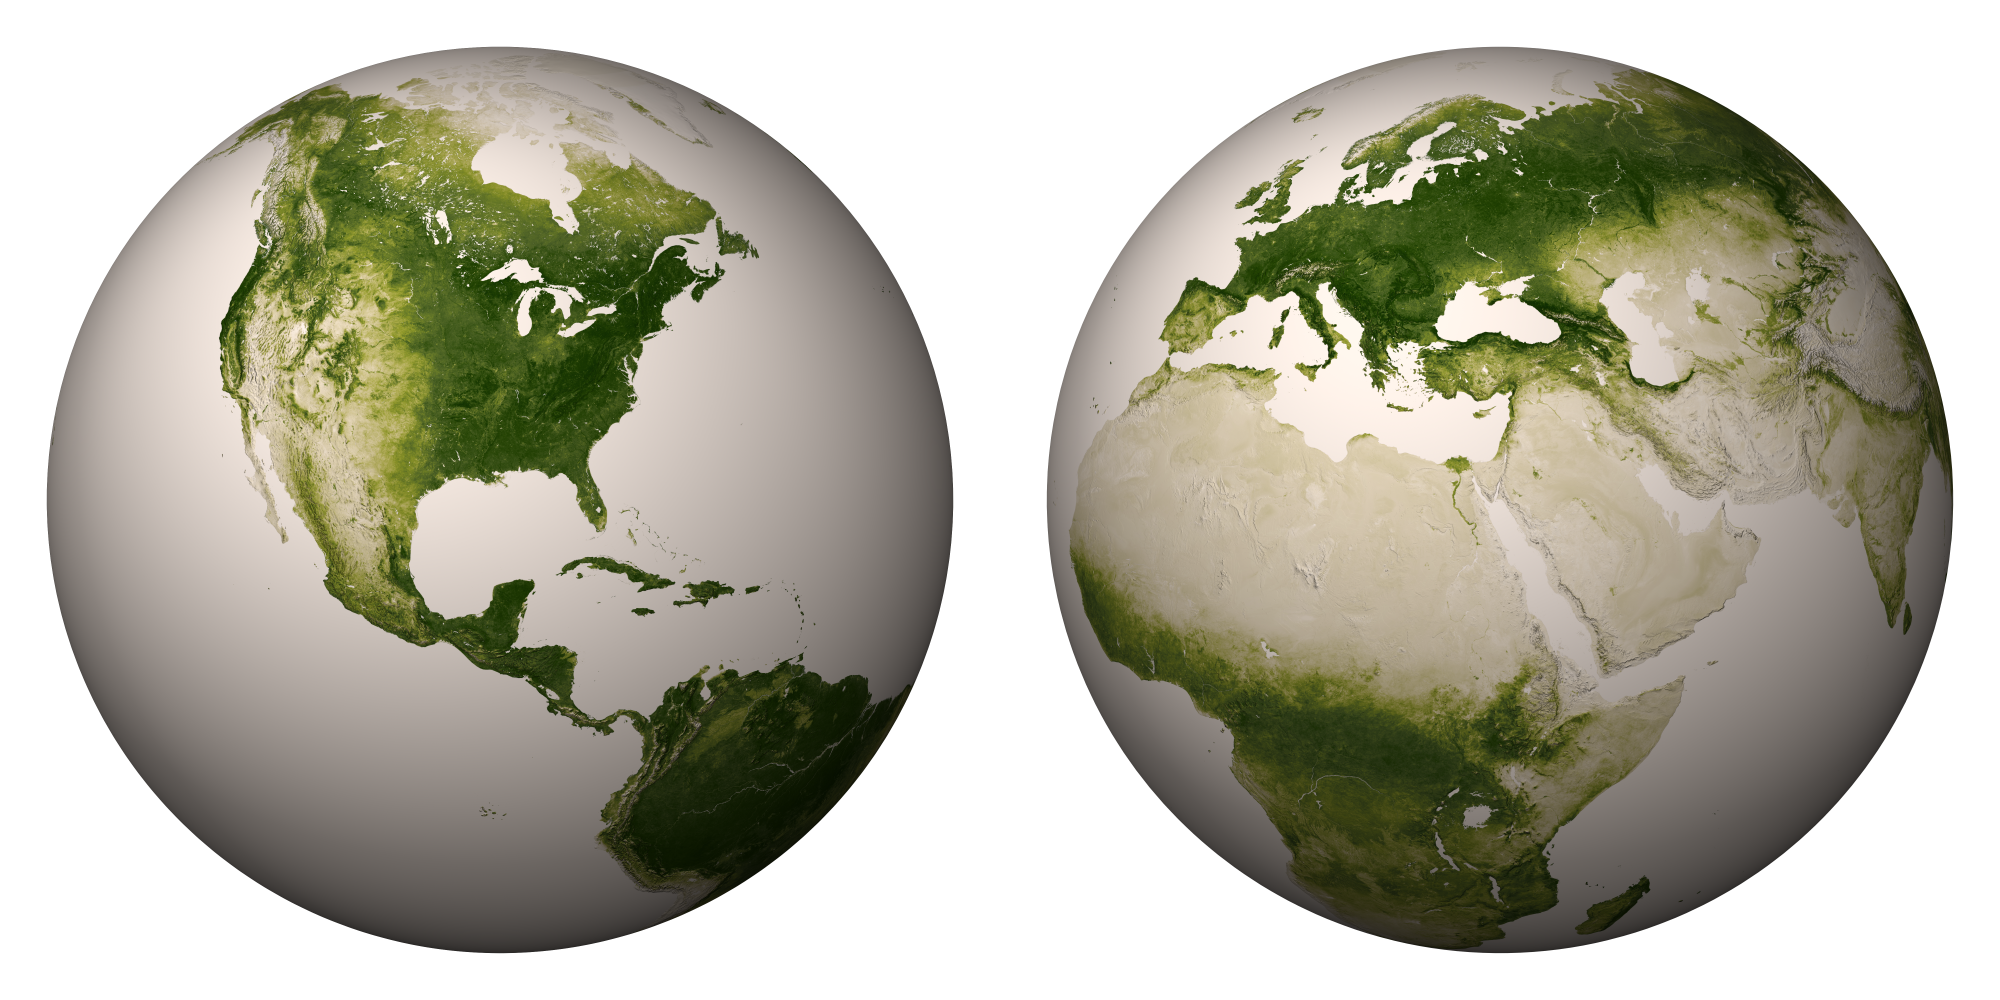
Scientists have released new high-resolution maps that illustrate the lushness of vegetation, or lack thereof, around the globe.
Researchers at NASA and the National Oceanic and Atmospheric Administration (NOAA) used satellite data from April 2012 to April 2013 to create maps like the ones below (click to enlarge).
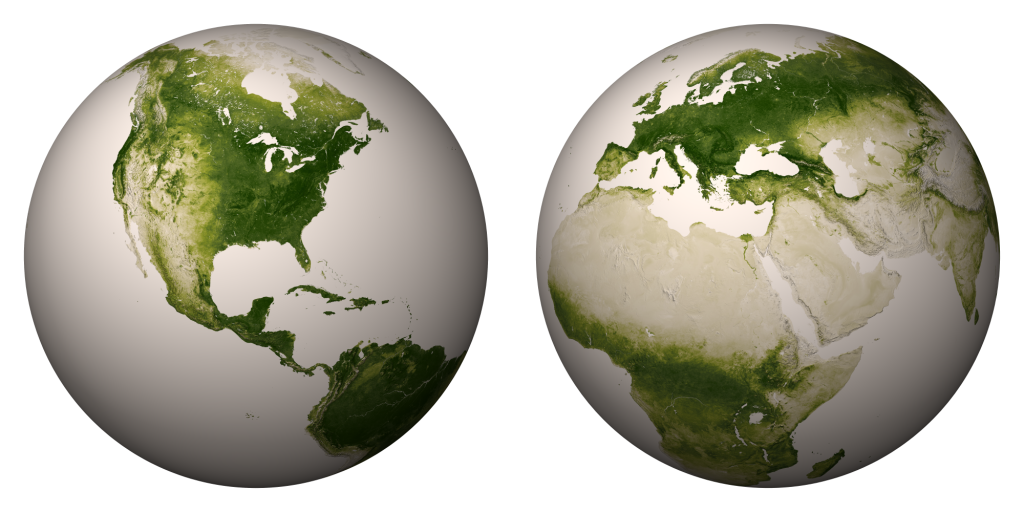
“The darkest green areas are the lushest in vegetation, while the pale colors are sparse in vegetation cover either due to snow, drought, rock, or urban areas,” NASA/NOAA says.
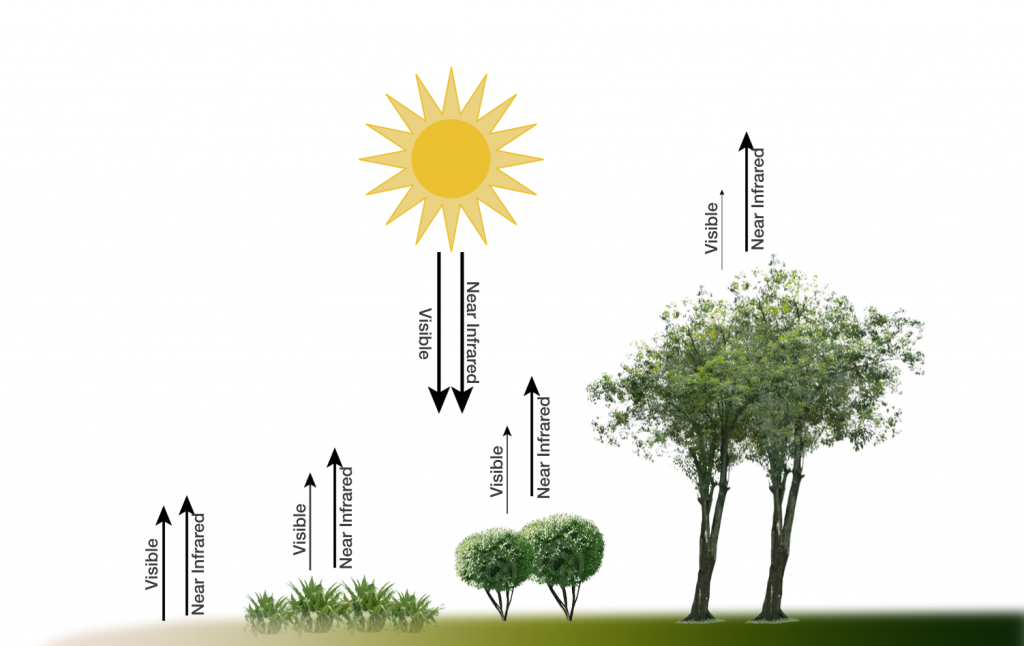
Satellites are able to gauge the lushness of vegetation because sunlight reflect off plants differently than cities, barren peaks, and other non-vegetated areas. “Plants absorb visible light to undergo photosynthesis, so when vegetation is lush, nearly all of the visible light is absorbed by the photosynthetic leaves, and much more near-infrared light is reflected back into space,” NASA/NOAA says. “However for deserts and regions with sparse vegetation, the amount of reflected visible and near-infrared light are both relatively high.” Here’s a diagram illustrating the concept:
Zooming into West
Compared to the rest of North America, the American West stands out for the relative lack of vegetation in many interior areas. Although the Pacific Northwest and taller mountain ranges show up as deep green, the Southwest looks pretty tan. Check out the rain shadow to the east of the Sierra Nevada Range, as well as the verdant ranges in the Great Basin, in this closeup:
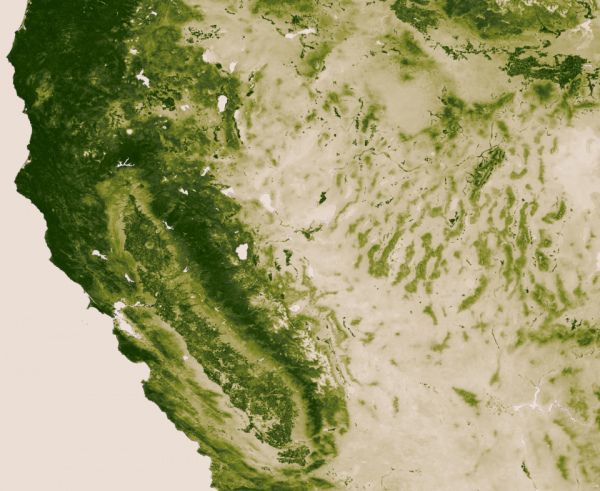
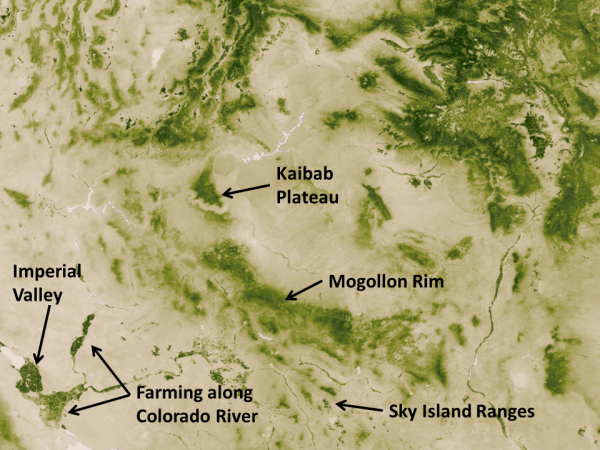
Below I’ve zoomed into the Southwest, where you can clearly see the irrigation along the Colorado River. I’ve also marked some notable islands of green, such as the Kaibab Plateau and the elevated archipelago of “sky island” mountain ranges in Southeast Arizona.
Downloading map
NASA/NOAA create a new greenness image every week. With a resolution of 500 meters (each pixel depicts about 62 acres), the weekly maps weigh in at 13 gigabytes each. You can download a 30,000 pixel by 15,000 pixel image (176 megabytes) and that’s what I’ve used to create the close-ups above.
Below is a video tour that shows how the vegetation changed during one year, both due to the changing seasons and human activities. The footprint of cities in Europe and Asia is striking.
EcoWest’s mission is to analyze, visualize, and share data on environmental trends in the North American West. Please subscribe to our RSS feed, opt-in for email updates, follow us on Twitter, or like us on Facebook.

