[pullquote]
40 years after the Clean Air Act became law, what are the major air quality issues in the West?[/pullquote]
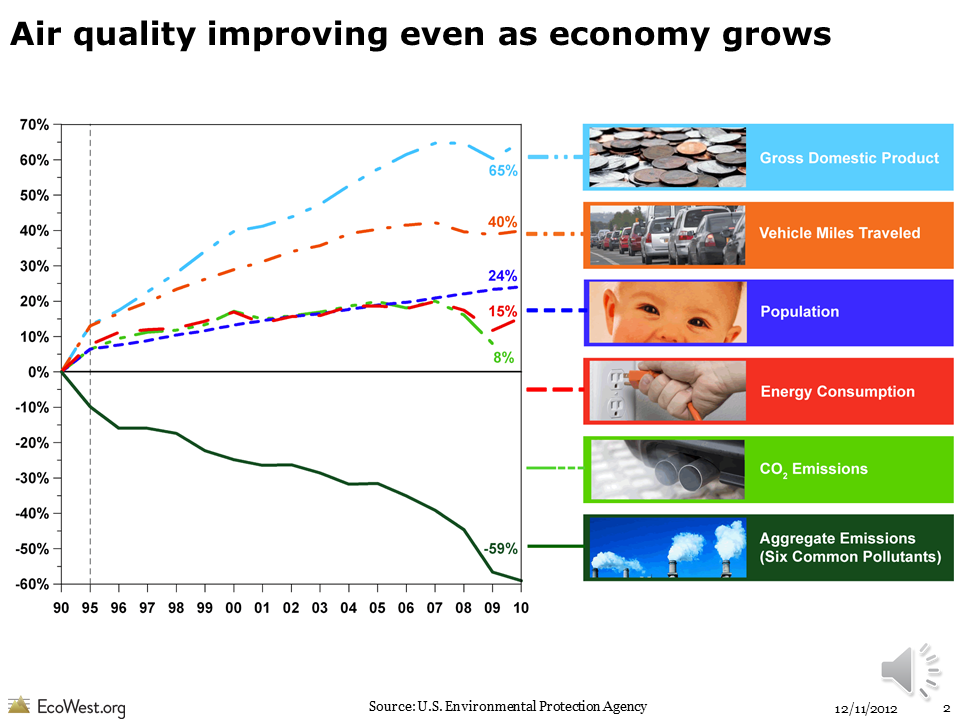
We’ve made significant progress in reducing pollution since the Clean Air Act (CAA) was enacted more than 40 years ago, even during a period of strong economic growth. Just since 1990, when the CAA was last amended, GDP is up 65%, while aggregate emissions of the six major pollutants that the U.S. Environmental Protection Agency regulates are down 59%. In this batch of slides, we show that the greatest improvements have been in reducing sulfur dioxide, lead, and carbon monoxide. But there’s still a lot of work ahead, both nationally and in the West. Progress has been less substantial in reducing particulates and ground-level ozone. Despite advances in technology and stricter regulations, millions of Westerners remain exposed to toxic air pollution.
Air pollution overview from EcoWest on Vimeo.
California still leads the country in “bad air days,” largely due to pollution in Los Angeles but also the Sacramento area. Bad air days result primarily from the slower progress made in reducing particulate matter (PM2.5) and oxides of nitrogen, a precursor to ground-level ozone.
As with population and economic activity, California tends to dominate the West’s air quality profile. When viewed in the national context, California’s emissions levels, air-pollutant based cancer risks, and bad air days have more in common with the populous eastern United States than other Western states.
Several of the slides examine emissions by major pollutant, using EPA’s 2008 inventory. California leads other states in particulate matter (which originates in smoke and dust), oxides of nitrogen (which come from power plants and fuel combustion), volatile organic compounds (which emanate from consumer products, paints, and industrial chemicals), and carbon monoxide (which primarily stems from motor vehicles).
Sulfur dioxide differs from the other major pollutants examined here. Fuel technology advances have largely controlled SO2 emissions from motor vehicles; SO2 emissions now primarily come from aging coal-fired power plants, older generating stations, and mineral extraction, sources that are concentrated in Wyoming, Colorado, and Arizona.
Downloads
- Download Slides: Air Pollution Overview (5572 downloads )
- Download Notes: Air Pollution Overview (5906 downloads )
- Download Data: Air Pollution Overview (9416 downloads )
EcoWest’s mission is to analyze, visualize, and share data on environmental trends in the North American West. Please subscribe to our RSS feed, opt-in for email updates, follow us on Twitter, or like us on Facebook.

