All posts by Mitch Tobin

Mitch Tobin, the editor of ecowest.org, is owner of Sea to Snow Consulting and was previously communications director at California Environmental Associates. Prior to joining CEA, Mitch was a newspaper reporter at the Napa Valley Register, Tucson Citizen, and Arizona Daily Star, where he covered water, environmental, and border issues for five years. He was also a contributor to High Country News. Mitch's first book, Endangered (Fulcrum 2010), evaluates the effectiveness of the Endangered Species Act and received a gold medal in the 2011 Independent Publisher Book Awards.

Annual Western poll shows strong support for conservation

For the past few years, Colorado College’s State of the Rockies Project has been conducting a Conservation in the West poll, and the results continually show strong support for protecting the West’s environment.

When voters in six states are asked about issues such as energy development, safety regulations, and public lands, they tend to prefer renewable technologies, keeping a close watch on business, and protecting open space for habitat and recreation. But there are some interesting regional differences, especially when it comes to energy.

We’ve created a short PowerPoint presentation, available for download at the bottom of this post, that summarizes some findings from the Conservation in the West polls. You can also view the slide deck in this embed:

Annual poll of Western voters shows strong support for conservation from EcoWest on Vimeo.

Limited sources on Western environmental public opinion

In an earlier post, we discussed the national-level results from Gallup’s polling on the environment. In some cases, Gallup has been asking the same question over and over, year after for year, for decades.

Unfortunately, we haven’t found any comparable public opinion surveys of the West that offer such a lengthy time series. Some states in the region have longstanding surveys, such as California’s Field Poll, which was established in 1947. The Public Policy Institute of California also puts out a yearly poll on the environment.

But when it comes to understanding how Westerners think about things like wildlife, carbon regulations, and the water supply, the best source we’ve found is Colorado College’s yearly polls. Here’s how The New York Times summed up the 2013 results:

Nine in ten people polled said that national parks, forests, monuments and wildlife preserves are essential to the economy. Three in four said that those lands furnish good jobs, and more than seven in 10 said that no public lands should be sold to private corporations. Three in five said that drilling should not be allowed in “critical locations” near recreation areas, water sources or wildlife. Only 35 percent said that more public lands should be opened to “responsible energy development.

In tandem with two pollsters (Lori Weigel of Public Opinion Strategies and Dave Metz of Fairbank, Maslin, Maullin, Metz & Associates), Colorado College conducted a survey of 2,400 voters in six Western states:  Arizona, Colorado, Montana, New Mexico, Utah and Wyoming.

Environment vs. economy: false dichotomy?

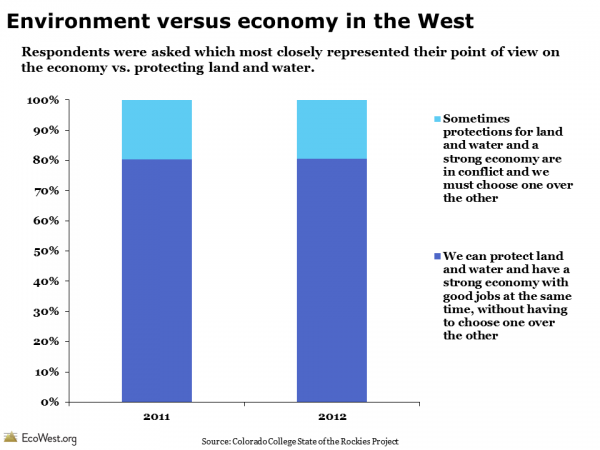
Although we hear a lot about the environment versus the economy, nearly 80 percent of respondents said we can simultaneously protect land and water while maintaining a strong economy.

State of the Rockies Conservation in the West Poll Environment vs. Economy

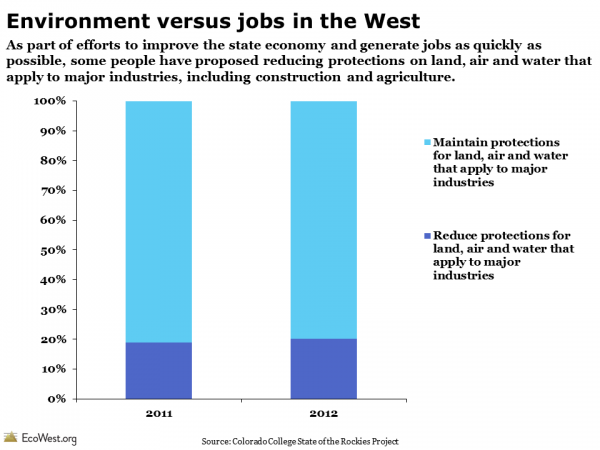
Below are the results from a similar question, which asked respondents whether they favored “reducing protections on land, air, and water” that apply to businesses in order to help the economy and generate jobs as quickly as possible. Fewer than one-fifth of Westerners supported that proposition.

State of the Rockies Conservation in the West Poll Environment vs. Jobs

Strong support for public lands

Regardless of political affiliation, the vast majority of Westerners believe that public lands support the economy and enhance the region’s quality of life, rather than “take land off the tax rolls, cost government to maintain them, and prevent opportunities for logging and oil and gas production that could provide jobs,” as shown in graphic below.
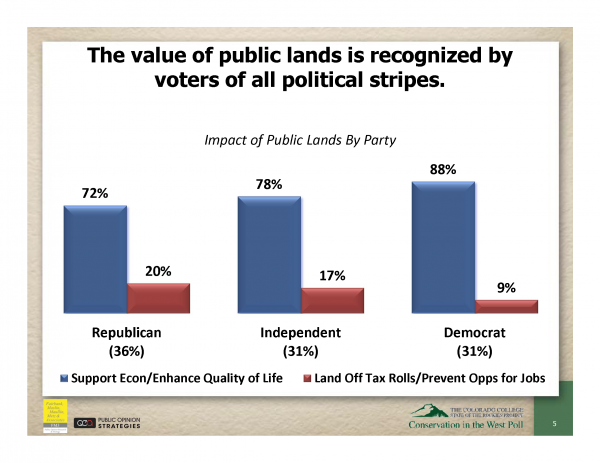
Conservation in West poll results

Diversity in state opinion on energy

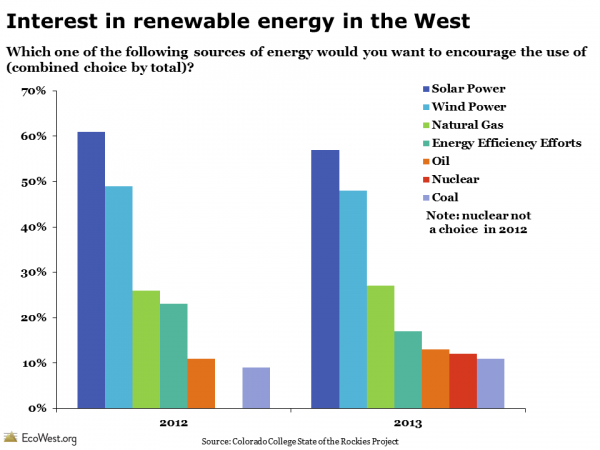
Many of the questions in the past three years of polling have related to energy. When asked which energy sources they’d like to encourage, solar and wind power come out on top and coal is at the bottom. Of the fossil fuels, Westerners favor natural gas, even rating it above energy efficiency efforts. The results are similar when people are asked about what energy sources they’d like to discourage.

Colorado College State of the Rockies Conservation in the West Poll: Interest in Renewables

Regional views on energy

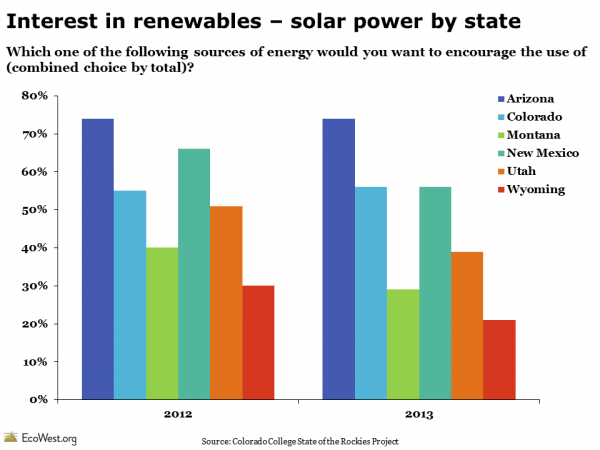
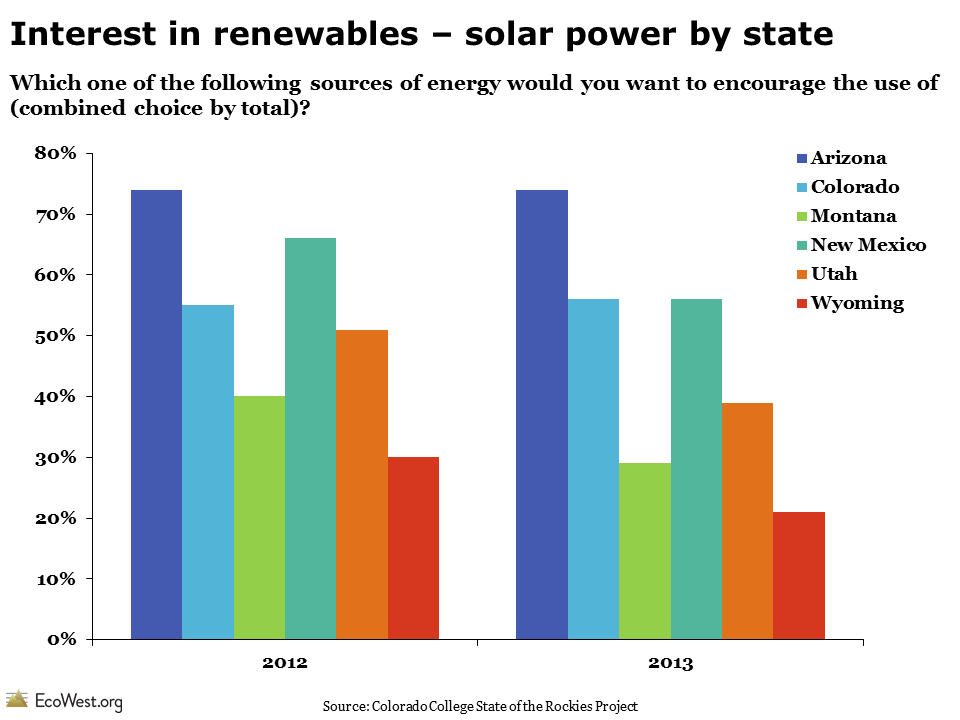
As we discuss in a previous post, the nation’s energy resources, both fossil and renewable, are not evenly distributed, so it’s no surprise that there are some significant differences among state residents when it comes to their energy preferences. The graphic below shows that in Arizona, Colorado, and New Mexico, majorities want to encourage solar, but support is lower in the other states and fell between 2012 and 2013 in Montana, Utah, and Wyoming

Colorado College State of the Rockies Poll Solar Energy

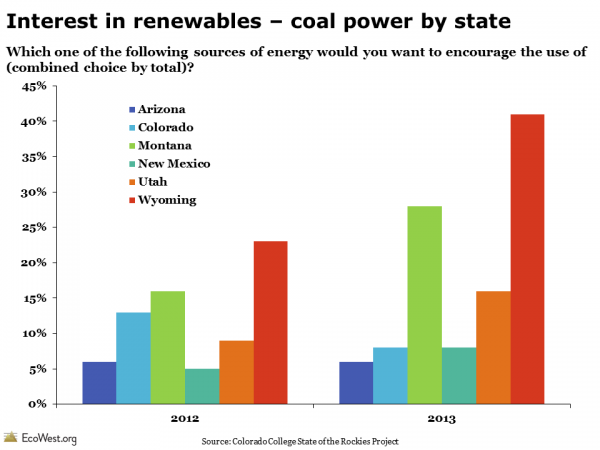
When asked about encouraging coal as an energy source, Wyoming stands out. No surprise there: it’s the largest coal-producing state in the country. There was also a large jump in support for coal from 2012 to 2013 in Wyoming, Montana, and Utah, but a decrease in support in Colorado. Perhaps the growing support for coal in some states is a backlash against increasing federal regulation of the fuel source.

Colorado College State of the Rockies Conservation in the West Poll Coal

Hopefully, the State of the Rockies project will continue to commission this poll so that we can keep tracking changes in Western public opinion in the years to come. If you find other surveys on Western environmental issues, please let us know.

Data sources

You can download data from the 2013 poll, a presentation summarizing the results, and state-level reports on this page. Results from 2011 and 2012 are also available.

Downloads

Thanks to Micah Day for assistance with this post.

EcoWest’s mission is to analyze, visualize, and share data on environmental trends in the North American West. Please subscribe to our RSS feed, opt-in for email updates, follow us on Twitter, or like us on Facebook.

Viewing biodiversity through the ecoregional lens

The Nature Conservancy’s Atlas of Global Conservation is a fabulous resource for understanding biological diversity. Scientists have divided up the world into more than 1,000 ecoregions and analyzed how they compare across dozens of measures.

I’ve used data from TNC’s atlas to create a slide deck that illustrates patterns in species richness and threats to biodiversity, with a focus on the United States and American West. Below is a video of the PowerPoint, which you can download at the bottom of this post.

Visualizing biodiversity through the lens of ecoregions from EcoWest on Vimeo.

Biome basics

Before we get to ecoregions, let me first note a broader way that TNC and others classify the natural world: biomes. An area’s climate more or less determines what types of plants can grow, and at the highest level we can classify the planet’s land masses according to the predominant vegetation, or lack thereof. There are 16 terrestrial biomes, ranging from snow and tundra to tropical forests.

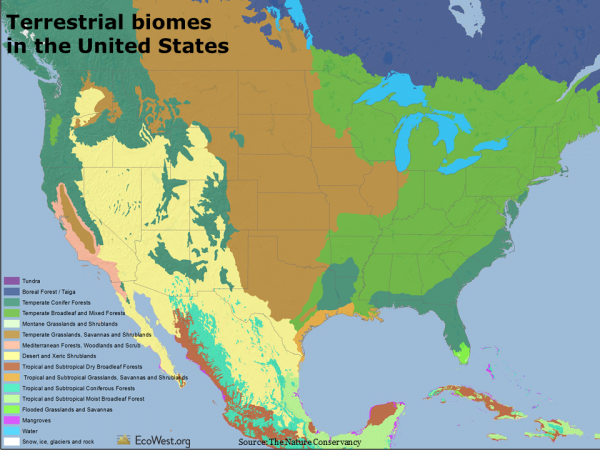
The map below (click to enlarge) shows the biomes found in the United States. Much of the interior West is dominated by desert and xeric (dry) shrublands, but the higher elevations support temperate conifer forests. California has Mediterranean forests along much of its coast and the Sierra Foothills. There’s a bit of subtropical forest in the mountains of Southeast Arizona and temperate broadleaf forest in Oregon’s Coastal Range.

United States biomes

As with temperature, rainfall, and elevation, there is more uniformity in the biomes found in the East than the West. Look, for example, at how many different types of communities are found in California, or how isolated mountains in the Great Basin create little biome islands.

The United States actually leads the world in the number of biomes and smaller ecoregions within its borders, even exceeding countries that are much larger in size, as shown in the graphic below.

United States biomes and ecoregions

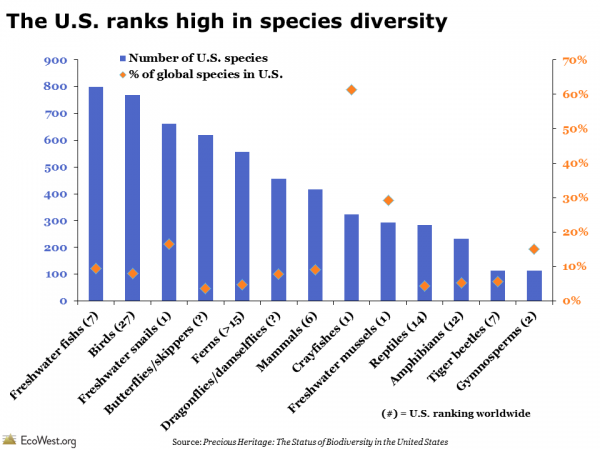
So it’s no surprise that the United States also ranks high in species diversity. In the graphic below, blue bars show the number of species by type. Orange diamonds show what percent of the world’s species are found in the United States and the number in parenthesis in the labels indicate the U.S. ranking worldwide. The highest levels of diversity for several groups are found in the United States, including freshwater mussels, freshwater snails, and crayfishes; several other groups, such as freshwater fishes and gymnosperms, are also well represented here.

United States ranks high in species diversity

Analyzing ecoregions

A more fine-grained view than biomes classifies the terrestrial world into 825 unique ecoregions. These areas are sort of like ecological neighborhoods with similar habitat. Below is a close-up of the American West. If you were to drive through several ecoregions on an interstate road trip, you’d notice the differences simply by looking out the window.

Ecoregions of the American West

TNC’s atlas also analyzes the planet according to its 426 freshwater ecoregions. Each of the regions has a unique collection of aquatic species and freshwater habitats. The map below shows the West’s two-dozen or so freshwater ecoregions, which generally correspond to the boundaries of important river basins.

Freshwater ecoregions of the American West

Dozens of biodiversity metrics

TNC’s atlas offers dozens and dozens of layers of geographic information by terrestrial, freshwater, and marine ecoregion. The deck that you can download at the bottom of this post has 71 slides, with views of both the world and United States.

To give you a taste of what’s available, here’s a summary of three slides.

1) Species diversity is greatest around the equator

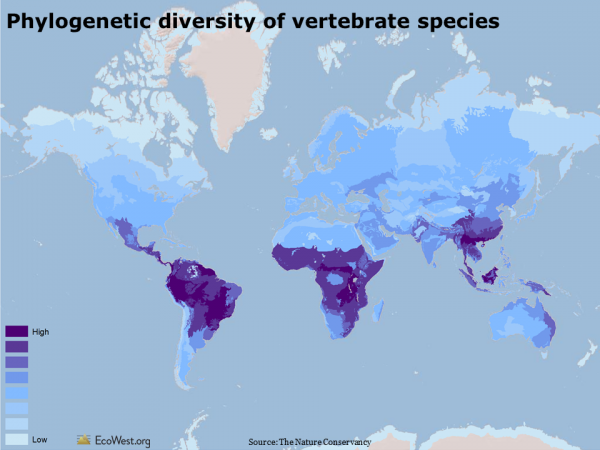
One way to describe biodiversity is to look at the evolutionary distinctiveness of species in a given location. The map below shows the phylogenetic diversity of terrestrial vertebrate species (animals with a backbone). Phylogenetics is a measure of how closely related a group of species is. An ecoregion with high phylogenetic diversity has species that are more distinct from one another (see this summary and this paper for more on the measure).

In general, measures of species diversity are greater at lower latitudes due to the past effects of Ice Age glaciation at higher latitudes and the configuration of islands and other landforms on the Earth, both past and present. In the West, phylogenetic diversity of vertebrate species tends to be highest in the desert Southwest.

Phylogenetic diversity of species

2) Hotspots for threatened animals 

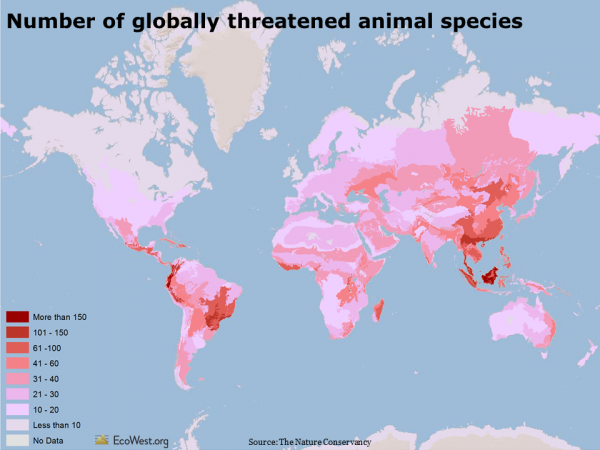
The analysis and conservation of biodiversity often focuses on those species most at risk of extinction. The map below shows the number of globally threatened animals by terrestrial ecoregion. Threatened species are those listed by the International Union for the Conservation of Nature’s Red List as vulnerable, endangered, or critically endangered. Globally, some of the greatest concentrations of threatened vertebrates are in South America and Southeast Asia. About half of the threatened animals are reptiles and amphibians, one quarter are mammals, and one quarter are birds. In the United States, the Southwest, the foothills around California’s Central Valley, the Southeast, and the Appalachians have the most threatened animals.

Number of globally threatened animals

3) Plenty of plants in arid American West

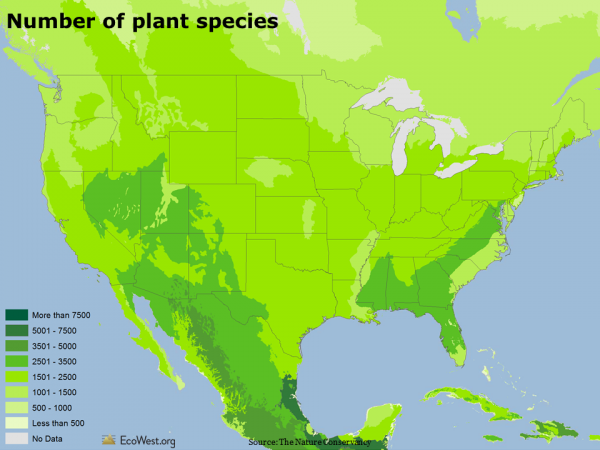
The map below shows the number of plant species by terrestrial ecoregion. Worldwide, there are more than 420,000 of the so-called higher order plants: trees, vines, grasses, fruits, vegetables, and legumes. Deserts and arid lands typically have fewer plant species, while tropical rainforests have the most. But in North America, some drier parts of the inland West actually have more plant species than wetter climes along the coast. Compare, for example, the Great Basin in Nevada to Washington.

Number of plant species

Those are just a few of the slides that I found most interesting. I’d be curious to hear from readers if they spot other patterns.

Data sources

To create the maps, I downloaded the GIS data from Data Basin (a search query for “Hoekstra,” as in atlas lead author and EcoWest advisor Jon Hoekstra, will return all the layers).

I highly recommend the book form of TNC’s atlas, which taught me a ton about biodiversity around the globe.

See this page for more background on ecoregions from WWF.

Downloads

EcoWest’s mission is to analyze, visualize, and share data on environmental trends in the North American West. Please subscribe to our RSS feed, opt-in for email updates, follow us on Twitter, or like us on Facebook.
Streamer tool traces rivers from sources to sea

The National Atlas has a new feature, Streamer, that lets you trace the flow of any U.S. stream or river, either going upstream to the sources or downstream to the sea.

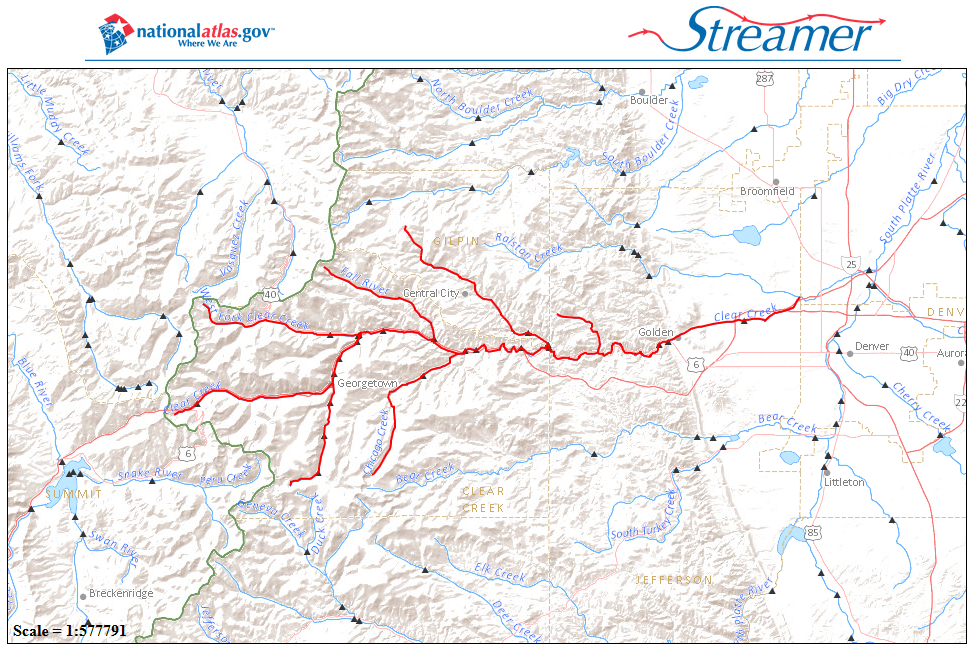
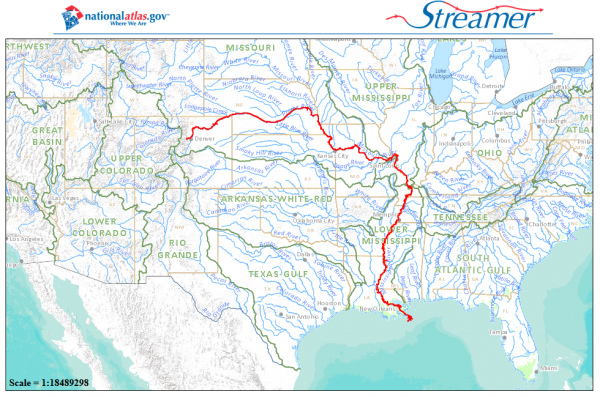
Below are a couple of screenshots from the tool (click to enlarge). I picked a point near the EcoWest compound in Denver, along Clear Creek. When you trace upstream, you effectively show the watershed that feeds a stream or river, and when you trace the path downstream, you see the circuitous path to the ocean.

 National Atlas Streamer Clear Creek UpstreamStreameNational Atlas Streamer Clear Creek Downstream

Another cool feature of this tool is that it produces a data report on the streams and rivers that you choose to trace. Using the example of Clear Creek, I found that the water will take a 2,487-mile journey from Denver to the Gulf of Mexico via the South Platte, Missouri, and Mississippi rivers, passing through 121 counties that are home to 10.4 million Americans.

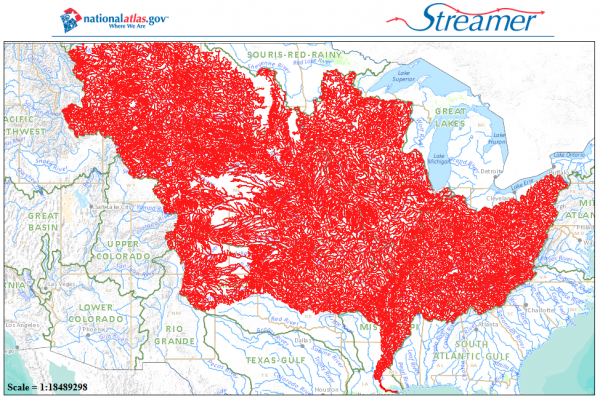
To mix things up, I also tried an upstream trace for New Orleans:

National Atlas Streamer New Orleans

When the Mississippi River enters the Gulf of Mexico, its waters have collectively passed through 1,553 U.S. counties containing nearly 85 million residents. The total length of all 7,028 streams and rivers in the Mississippi’s watershed is a mind-boggling 300,243 miles. If you were to string together all of these streams and rivers, this über waterway would wrap around the Earth a dozen times.

What’s great about the Streamer tool is its simplicity: you click on a point and instantly find out where the water is coming from and where it’s going.

If only Lewis and Clark had access to something like this.

Data sources

Streamer doesn’t include every single creek, brook, and rivulet of water in the country. You’ll only see the major streams and rivers that are part of a dataset that you can download here. If you haven’t already, I highly recommend playing around with the National Atlas. which visualizes hundreds of layers of geographic data.

EcoWest’s mission is to analyze, visualize, and share data on environmental trends in the North American West. Please subscribe to our RSS feed, opt-in for email updates, follow us on Twitter, or like us on Facebook.