The American West is evolving faster than ever. Population growth is increasing pressure on scarce resources. Climate change is compounding traditional environmental threats. Demographic trends are reshaping the region’s complexion.
Such rapid, profound changes make it vital to analyze and share data on the West. Browse through any newspaper in the region and you’ll see detailed dashboards depicting stock prices, batting averages, and weather forecasts. But what about the state of the West itself? Is the environment improving or declining? What’s happening with droughts, floods, and fires? Which species are in trouble? Where is our energy economy heading?
We’ve created EcoWest to answer these questions, and many others.
Visualizing environmental trends
EcoWest’s mission is to creatively communicate what the latest research, monitoring, and polling is revealing about how the West is changing. In essence, we’re trying to tell the story of the region’s environment through the medium of PowerPoint slides, graphics, charts, maps, dashboards, and other data visualizations.
Although EcoWest.org has been live for some time now, it’s been in beta mode as we’ve been testing features, wrapping up initial research, and populating the site. As of now, we’re officially launched!
So how does this thing work?
Since 2010, we’ve been gathering, sorting, sifting, slicing, and dicing reams of data on environmental trends. We’ve organized our research and conclusions into a half-dozen narrated PowerPoint presentations that cover biodiversity, climate change, land use, politics, water, and wildfires in the West. On each of these main pages, you can download the slide deck, notes, sources, and underlying data, as well as watch a video of the presentation. Sub-pages, such as this one on wildfire trends, are where you’ll find dashboards that allow you to interact with the data and download images.
Starting now, we’ll be posting new content a couple times a week, culling relevant material from the news cycle and commenting on new research. We’ll be updating the EcoWest material as new data becomes available and plan to grow the site in the years ahead.
What have you concluded from all this research?
A good place to start is our executive summary deck, which draws from the half-dozen PowerPoint presentations and synthesizes the findings of the research. Links to download the presentation are at the bottom of this post.
It requires both chutzpah and simplification to summarize a sprawling region that is defined by the very diversity of its ecology, climate, and people. But let me be so bold as to encapsulate the findings into a half-dozen points:
1) The human footprint in the West is surprisingly large
Among the most striking aspects of the American West are its unpopulated expanses and the prevalence of public land. But humanity’s imprint is already deep and indelible in most of the region. Sure, population growth is a big driver, but it’s actually agriculture that creates a bigger footprint than cities, suburbs, and other residential development. Even remote public lands may be crisscrossed by highways or carved up by industrial activities that are permitted under the multiple-use doctrine. The West is still home to some of the wildest and least disturbed landscapes on the continent, but only some of these relatively pristine areas are strictly protected as wilderness, national parks, or other preserves.

2) Growth and climate change are compounding the water crisis
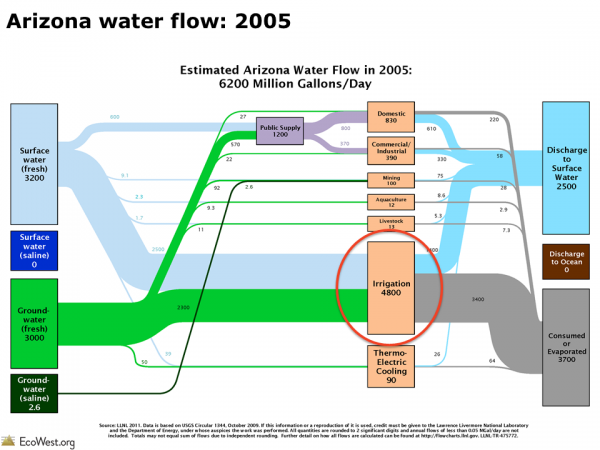
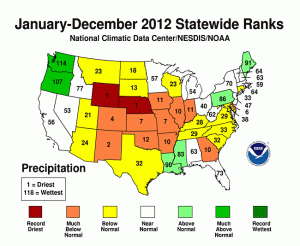
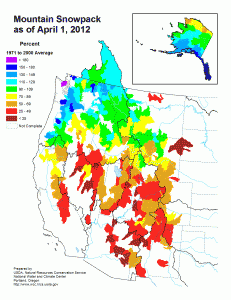
For more than a century, smart people have been warning about the perils of settling an unforgiving land with an inherently capricious water supply. Even without considering climate change, the West would be facing a water crisis pitting rising demands against limited resources. As global warming shrinks the vital snowpack and reduces the flow in some key river basins, conflicts over water are bound to increase, but so are transfers of water rights. With farms still consuming the vast majority of the region’s water and cities searching for new supplies, we’ll be seeing more and more water changing hands. Municipal water demand is certainly increasing, but it’s still less than what the energy sector withdraws from streams, rivers, lakes, and reservoirs. It not only takes gobs of water to power our energy economy; it also takes a ton of energy to pump, move, clean, and deliver water.

3) Species were in trouble even without climate change
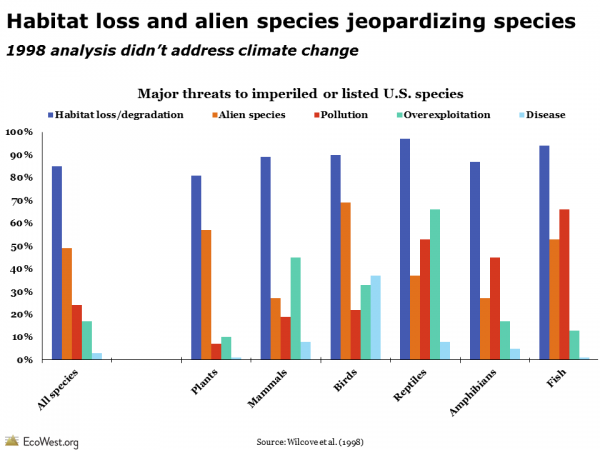
The West is home to some amazing wildlife success stories. Game species that were almost wiped out during the first waves of settlement, such as deer, elk, and pronghorn, have bounced back, sometimes to the point of overpopulation. Endangered species, such as California condors and black-footed ferrets, have been pulled back from the brink. Yet the number of imperiled plants and animals continues to grow, despite political meddling with the Endangered Species Act. In the West and elsewhere, freshwater species are in especially dire straits. Few plants and animals are now threatened by overhunting and collecting, but habitat loss and invasive species remain chronic problems. Climate change, which is already transforming entire ecosystems, could pose an existential threat to some species by eliminating their habitat.
4) Wildfires are growing larger and will only get worse
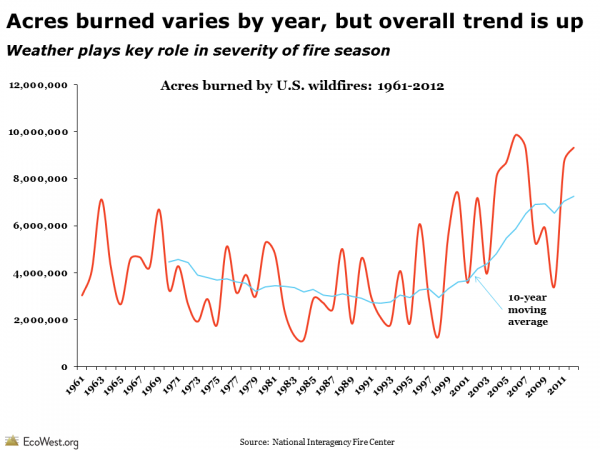
Climate change and the legacy of misguided fire suppression will continue to make the West’s wildfire season longer, costlier, and more destructive. Not all fires are bad, and not all acres burned are “destroyed,” as the media often reports. But while fire is an essential part of most Western forests, woodlands, and grasslands, many ecosystems are ecologically out of whack. The government has been treating an increasing number of acres with mechanical thinning and prescribed burns, but it’s just a drop in the bucket. As temperatures keep increasing and the snowpack melts earlier in the year, the wildfire season is expected to lengthen and worsen. At the same time, more and more Westerners are living in the wildland-urban interface, where homes and businesses are especially vulnerable to wildfires.
5) Westerners want a vibrant economy and a healthy environment
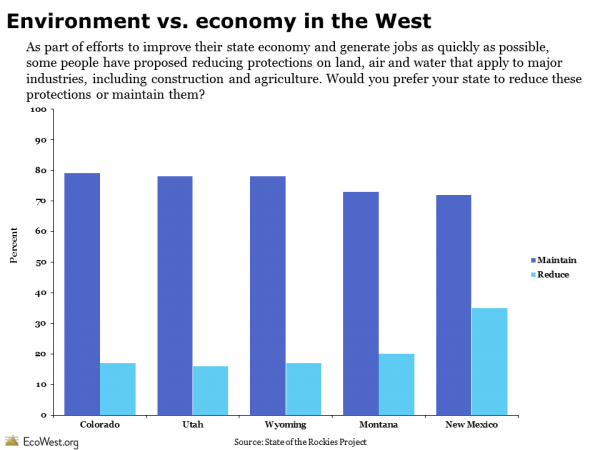
It’s no surprise that the environment tends to rank low on the public’s agenda during an economic downturn. But Americans—and Westerners in particular—often support the environmental movement’s goals of reducing pollution, promoting renewable energy, and protecting public lands. To be sure, the old environment-versus-economy dichotomy is still part of our political rhetoric, but if you drill down into polling results, especially in the West, you’ll find that many people reject that as a false choice and see a vibrant economy as dependent on a healthy environment. Even so, recent polls have shown an upward trend in hostility toward environmental groups.
6) Reason for hope: we’re getting cleaner and more efficient
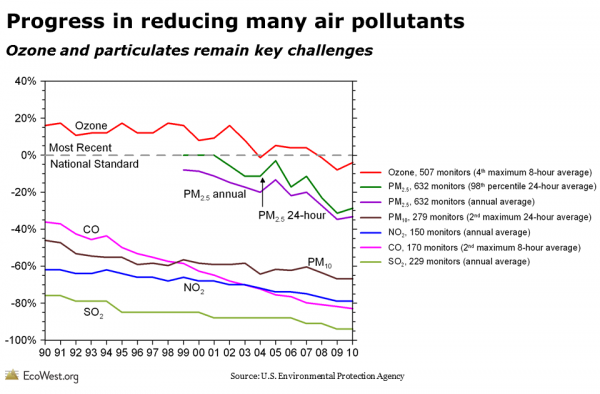
Although millions of Westerners remain exposed to toxic air pollution, it’s undeniable that the air quality in most places is better than it was decades ago. Just as the Clean Air Act has cleansed the skies of many hazardous materials, the Clean Water Act has also led to some dramatic improvements in our water quality. Overall, we’re becoming more efficient in our water and energy use, thanks to new technologies and a stronger conservation ethic. While fossil fuels continue to dominate our energy economy, wind power is making huge strides and becoming competitive with power plants burning natural gas, while solar panels are popping up on the roofs of homes and businesses across the region.
In short, the West is at risk and many of the trends are troubling, but even this cynical native New Yorker can find some glimmers of optimism amid the gloom and doom.
Who is behind this project?
EcoWest is a product of California Environmental Associates, the environmental consulting firm where I’m communications director, and it’s supported by the David and Lucile Packard Foundation’s Western Conservation subprogram, which seeks to “protect and restore biologically important and iconic areas of the North American West in ways that help create sustainable communities and build broader and more effective conservation constituencies.”
We’ve been working as consultants to the Packard Foundation since 2010, writing independent evaluations of their grantmaking and monitoring trends in Western conservation. Although this site is supported by the Packard Foundation, they do not exert editorial control over the content, and the opinions expressed on this site are not necessarily shared by the Foundation or its grantees.
While developing EcoWest, we’ve been consulting with a half-dozen advisors who have helped us interpret the data, explain the limitations, identify emerging threats, and look across the issues to highlight priorities for Western conservation.
I also want to give a shout out to my fabulous colleagues at California Environmental Associates who have assisted with the project.
How can I stay connected to EcoWest?
Pick your poison! We broadcast our content on a variety of channels, so please subscribe to our RSS feed, opt-in for email updates, follow us on Twitter, or like us on Facebook.
I’d also like to encourage you to add your own voice to the conservation conversation by commenting on posts, and I invite you to share any feedback on the site by contacting me directly.
I have a ton of great content that I’m excited to share and I hope you’ll join me on the journey ahead.
Downloads


