Over the past few years, I’ve been creating slides—hundreds and hundreds them. The David and Lucile Packard Foundation, a major environmental funder, asked us to take stock of the state of the North American West, one of its geographic priorities. Rather than write a report that would quickly be shelved, we decided to answer the question in PowerPoint by developing a half-dozen presentations that summarize environmental trends (see our summary here).
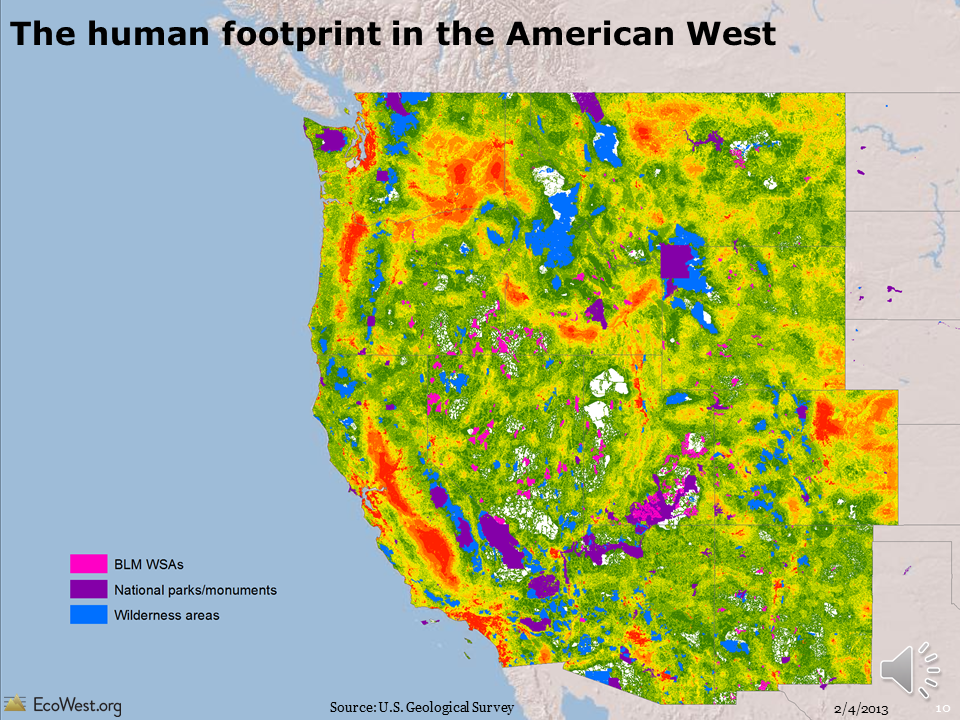
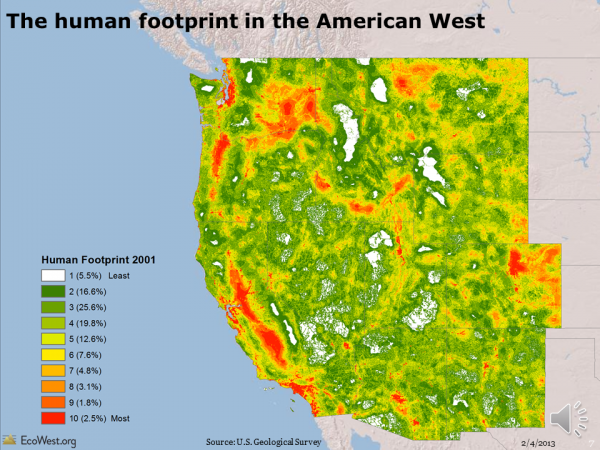
If I had to pick a “favorite” slide out of the more than 500 I created, it would be the one below, which illustrates the intensity of the human footprint in the region based on an analysis of urbanization, agriculture, transportation networks, energy development, and other factors.
I put “favorite” in quotes because this slide isn’t exactly something to celebrate. Rather, this map offers a stark reminder that we’ve already messed up much of the West
Despite the preponderance of public land in the region, few areas have been spared from direct—and oftentimes permanent—human influence. Even landscapes far from any city or suburb have been irreparably altered by farms, roads, gas wells, invasive species, and a host of other human-driven forces.
[pullquote]Western paradox: much of the region is nominally protected, but humanity’s imprint is already deep and indelible.[/pullquote]
At the same time, this map shows that the West is still home to vast expanses of untrammeled land and some of the wildest terrain left on the continent. In light of climate change, we can no longer describe any place on Earth as pristine. But the blank spaces on this map still retain the natural qualities that have captivated visitors for centuries and they continue to support an amazing array of ecosystems.
Mapping the human footprint in the American West from EcoWest on Vimeo.
Measuring human impacts
The human footprint map is based on the work of U.S. Geological Survey (USGS) scientists and was the basis of a 2008 paper in Ecological Applications by Matthias Leu, Steven E. Hanser, and Steven T. Knick.
White indicates areas with the least human impact (5.5% of the region), followed by green for places where the footprint is minimal, while orange and red areas are where people have done the most to transform native ecosystems.
To develop the map, the scientists focused on 14 features, including the location of cities, farms, transportation networks, irrigation canals, power lines, oil and gas wells, and human-caused wildfires. Based on this geographic data, the researchers were able to model how humans influence wildlife populations, both directly as we modify or destroy habitat, and more indirectly, as we introduce non-native predators and invasive species. “These actions,” the researchers write, “can impact plants and wildlife to such an extent that the persistence of populations or entire species is questionable.”
Although the researchers were primarily interested in modeling effects on shrubland species, they produced maps for all 11 Western states that rate the human footprint from 1 (least) to 10 (most). Here are some of the reference locations for each human footprint class:
- Yellowstone National Park, Death Valley National Park, and the crest of the Sierra Nevada Mountains, California
- Mount Rainier National Park, Washington
- Rocky Mountain National Park, Colorado and Mount Shasta, California
- Columbia River Gorge, Oregon
- Foothills west of Boulder, Colorado
- Bitterroot Valley south of Missoula, Montana
- Salinas Valley, California
- Agricultural areas in the Snake River Plain, Idaho and in Napa Valley, California
- Agricultural areas near Kennewick, Washington
- Boise, Idaho, Los Angeles, and agricultural areas south of Fresno, California
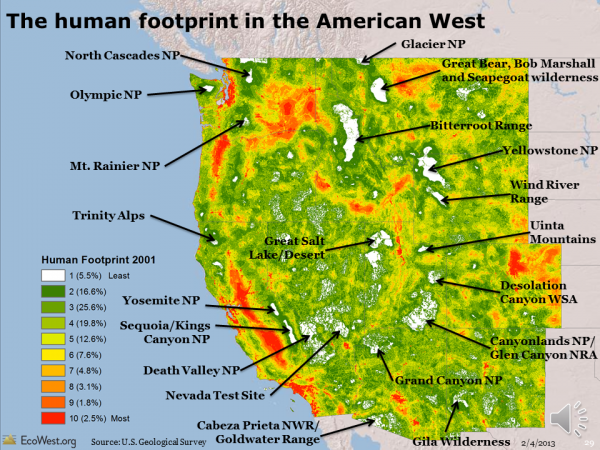
What’s really cool about this map is its detailed resolution: 180 meters, or 591 feet. I must confess that I’ve spent an inordinate amount of time zooming around this map and ground-truthing it against my travels in the region. If you love spending time in the wilderness, the white and deep green pixels offer a sort of bucket list for backcountry trips. I’ve annotated some in the map below.
Farms have biggest footprint
As you might image, many of the most heavily impacted areas are in and around cities, with the metropolises of Southern California, the Bay Area, Puget Sound, and the Colorado Front Range showing up clearly.
But it turns out that agriculture has the biggest footprint in the region, sometimes in places without many people. While the Central Valley of California and the Willamette Valley of Oregon are home to some good-sized cities, there aren’t many residents in the orange and red sections of Southeast Washington and Southern Idaho.
Undeveloped lands still vulnerable
Many of the white and deep green sections are already protected as wilderness areas, usually in national forests or national parks, but sometimes on land managed by the Bureau of Land Management (BLM) and Fish and Wildlife Service. In this version below, blue indicates the location of wilderness areas in places such as the Sierra Nevada, Mojave Desert, Northern Cascades, and Northern Rockies. Purple shows where national parks and monuments are located. Larger parks, such as Yellowstone, Glacier, Death Valley, Yosemite, Grand Canyon, Canyonlands, and Olympic are clearly visible. Pink depicts so-called Wilderness Study Areas, which the BLM is currently managing as wilderness but which haven’t been permanently protected by Congress.

These wilderness areas, parks, monuments, and Wilderness Study Areas cover many of the least disturbed areas, but not all of them. Most of the other areas that are white or deep green are public lands, but they are not receiving the special protections afforded to wilderness and preserves. Even land that is ostensibly “public,” such as the millions of acres of state-owned school-trust land in the West, may be vulnerable to development because state governments help fund their educational systems through the sale and lease of such parcels.
Mapping the human footprint in the West isn’t just an academic exercise. “Because funding for restoration and conservation projects is limited,” the USGS researchers write, “and because there is little room for errors in the management of species of concern, land managers are able to maximize restoration and conservation efforts in areas minimally influenced by the human footprint.”
Poring over these maps, I was surprised by the extent of farming’s footprint and impressed by the size of some undeveloped areas in the Northern Rockies and Southwestern deserts.
What geographic patterns strike you as most meaningful? Does the map match your own experiences in the West?
Data sources
You can learn more about the analysis and download the data on this USGS website. The 2008 Ecological Applications paper is available here and the USGS offers a summary here.
Downloads
EcoWest’s mission is to analyze, visualize, and share data on environmental trends in the North American West. Please subscribe to our RSS feed, opt-in for email updates, follow us on Twitter, or like us on Facebook.