All posts by Mitch Tobin

Mitch Tobin, the editor of ecowest.org, is owner of Sea to Snow Consulting and was previously communications director at California Environmental Associates. Prior to joining CEA, Mitch was a newspaper reporter at the Napa Valley Register, Tucson Citizen, and Arizona Daily Star, where he covered water, environmental, and border issues for five years. He was also a contributor to High Country News. Mitch's first book, Endangered (Fulcrum 2010), evaluates the effectiveness of the Endangered Species Act and received a gold medal in the 2011 Independent Publisher Book Awards.

Hawaii, West and South have most at-risk species

The United States boasts the greatest diversity of ecosystems of any country and it’s home to more than 200,000 species. But about one-third of U.S. plants and animals are considered at risk by biologists, and at least 500 U.S. species are already extinct or missing.

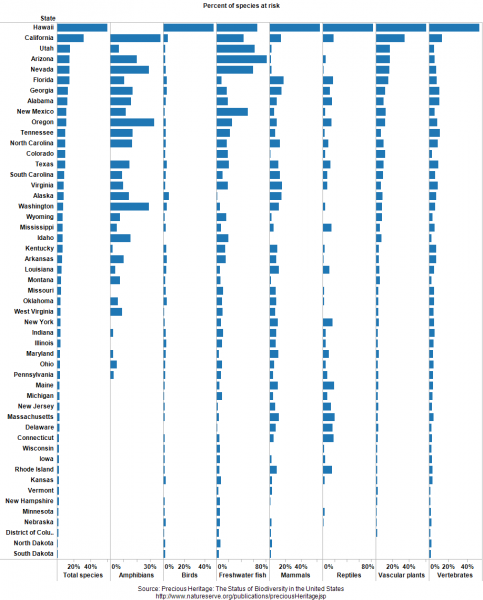
How do the 50 states compare in terms of number of species—and their imperilment? I’ve created some simple dashboards that illustrate the state-by-state tallies. These graphics, which you can sort, print, and customize, show the number of various types of species found in each state and the fraction of those species that are imperiled.

Percent of species at risk

The data comes from Precious Heritage: The Status of Biodiversity in the United States, a great book produced by The Nature Conservancy and NatureServe in 2000. At-risk species have elevated risks of extinction, according to the system developed by the project, and therefore have the greatest conservation concern.

Here are some of the patterns I noticed in the dashboards:

  • Despite their aridity, many Western states have tons of species. Arizona and New Mexico, neither of which have any coastal habitat, rank third and fourth in total number of species.
  • Hawaii has by far the greatest percent of species at risk. The native biodiversity of this isolated archipelago has been devastated by the introduction of non-native species.
  • States in the West, especially the Southwest, also have many imperiled species. California, Arizona, Utah, and Nevada round out the top 5 states.
  • Freshwater fish are doing very poorly, especially in the West, where Arizona, Utah, Nevada, New Mexico, California, and Oregon all have at least 25 percent at risk.
  • Outside of Hawaii, birds tend to be doing better than many other types of species.

Using the dashboard

A couple of notes about the dashboards:

  • You can sort by state name or by any of the variables at the bottom.
  • Because Hawaii is such an outlier, I can be helpful to examine the dashboard by excluding that state (just click on the name and the option will pop up).
  • The toolbar at the bottom allows you to create an image or PDF, plus download the underlying data.
  • This dashboard reports the percent of a state’s species at risk, not the actual number, but that data is also provided in Precious Heritage.

Learn more in our biodiversity deck

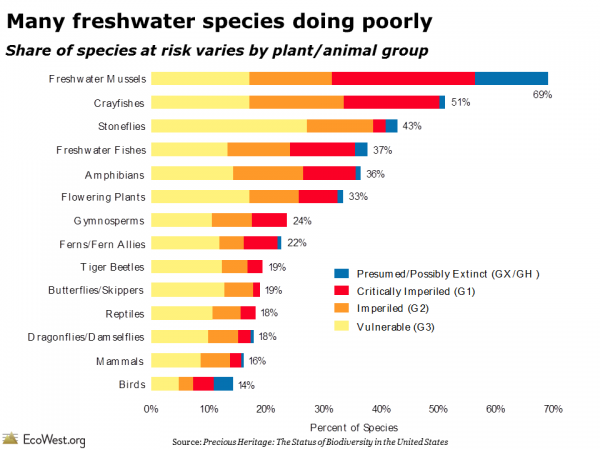
These dashboards focus on the state level, but in our biodiversity slide deck we offer a slew of maps and graphics summarizing the national picture. The one below shows that many freshwater species are in jeopardy, whereas some of the best known types of species, such as birds and mammals, are doing comparatively better.

National species at risk

Data sources

Anyone doing research on U.S biodiversity should definitely check out the Precious Heritage book. It contains a wealth of information on the status of U.S. species and many of the graphics in the book are available for free download on this page.

EcoWest’s mission is to analyze, visualize, and share data on environmental trends in the North American West. Please subscribe to our RSS feed, opt-in for email updates, follow us on Twitter, or like us on Facebook.

Interactive population maps from Census Bureau

It’s hardly news that the West’s population is booming, but which counties in region are growing fastest? How has the demographic profile of Western states been changing?

The U.S. Census Bureau offers up some great interactive maps that depict population changes between 2000 and 2010. These maps, which you can embed in websites and blogs, also show how the racial composition of states changed during the first decade of the 21st century.

I’ve compiled the maps for all 11 Western states on this page, which also includes a national overview.

Some rural counties losing residents

Below is an example from Colorado. Although the state’s overall population rose 17% from 2000 to 2010, plenty of counties actually lost residents during the decade. The shrinking counties are found in rural, agricultural regions, while many of the fastest growing counties are located near cities in the Front Range, from Fort Collins to Denver to Colorado Springs, and along the state’s Western Slope. This same pattern of declining rural populations holds true in some other Western states, such Montana, New Mexico, and Oregon.

Latino population rising

One of the most striking trends is the sharp rise in the number of Latino residents. Below is a map for Nevada, which saw its Latino population increase by 82% from 2000 to 2010. Every state in the region experienced strong growth in Latino residents, ranging from 25% in New Mexico and 28% in California, which already had large Latino populations in 2000, to 73% in Idaho and 78% in Utah, which ranked third and second behind Nevada. Overall, the Latino share of the U.S. population increased 41% from 2000 to 2010.

EcoWest’s mission is to analyze, visualize, and share data on environmental trends in the North American West. Please subscribe to our RSS feed, opt-in for email updates, follow us on Twitter, or like us on Facebook.
2012 was hottest year on record for U.S.

No doubt about it: 2012 was toasty. Today, the National Oceanic and Atmospheric Administration reported that 2012 was not only the warmest on record for the lower 48 since 1895 but also the second worst on a measure known as the Climate Extremes Index, which includes factors such as temperature anomalies, drought patterns, and the strength of tropical storms (you can create your own visualizations of the index here).

I’ve put together some of the summary graphics from the report and related media coverage in this slide deck.

2012 was hottest year on record in U.S. from EcoWest on Vimeo.

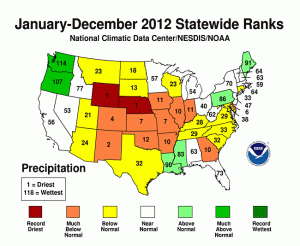
It was definitely an abnormal weather year for the American West (when was the last year that felt “normal”!?). Wyoming, Utah, and New Mexico all had their hottest years on record, while 2012 ranked second warmest for Colorado and Nevada. The story for precipitation was more varied, with many inland states suffering a deep drought as Oregon and Washington experienced some of their wettest years since the late 19th century.

2012 precipitation state rankings
2012 statewide rankings for precipitation. Source: National Climatic Data Center

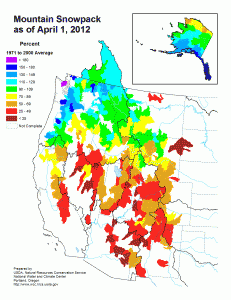
Nationwide, the extent of snow cover was the third smallest since 1966/1967. In the West, areas outside of the Northern Rockies and Pacific Northwest had a meager snowpack by April 1, 2012.

April 1 2012 snowpack
Snowpack on April 1, 2012. Source: National Climatic Data Center

It’ll be interesting to see if this stark summary of extreme weather in the United States gains any traction in the national conversation. This report is currently the top story on the websites of the New York Times and Washington Post.

For more on the effects of rising temperatures in the American West, check out our climate deck.

Downloads

EcoWest’s mission is to analyze, visualize, and share data on environmental trends in the North American West. Please subscribe to our RSS feed, opt-in for email updates, follow us on Twitter, or like us on Facebook.