All posts by Mitch Tobin

Mitch Tobin, the editor of ecowest.org, is owner of Sea to Snow Consulting and was previously communications director at California Environmental Associates. Prior to joining CEA, Mitch was a newspaper reporter at the Napa Valley Register, Tucson Citizen, and Arizona Daily Star, where he covered water, environmental, and border issues for five years. He was also a contributor to High Country News. Mitch's first book, Endangered (Fulcrum 2010), evaluates the effectiveness of the Endangered Species Act and received a gold medal in the 2011 Independent Publisher Book Awards.

State energy dashboard compares use, prices, and spending

The 50 states pursue different paths to supply energy to their residents, with some heavily reliant on coal, others dependent on hydropower dams, and many tapping a broad portfolio of sources. I described this diversity of approaches in previous posts on energy flow diagrams and a map of the “United States of Energy.”

In this post, I take a closer look at how U.S. states compare in their energy consumption, spending, and prices. Using data from the U.S. Energy Information Administration’s Annual Energy Review, I created a dashboard to visualize the patterns, and I put together an accompanying slide deck that you can download at the bottom of this post.

Per capita energy consumption

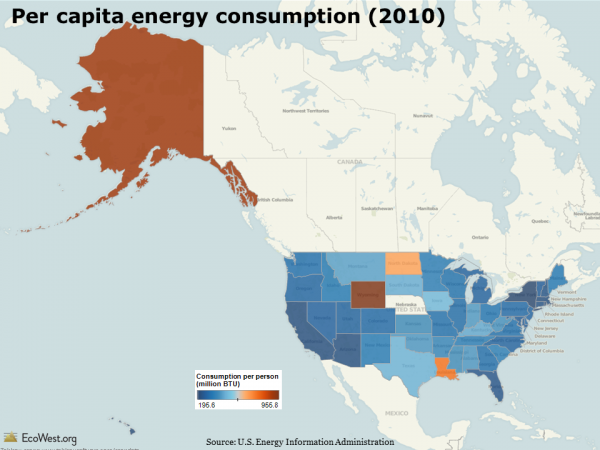
The map below (click to enlarge) illustrates per capita energy consumption in 2010. Four states—Alaska, Wyoming, North Dakota, and Louisiana—stick out. This group of states shares two things in common. First, all have relatively low populations, so the denominator in the per capita calculation is small. Second, all four states are major energy producers. Because it generally takes a lot of energy to extract, produce, and distribute fossil energy sources, these states also rank high on consumption.

Per capita energy consumption by state (2010)

Energy use, prices, and spending

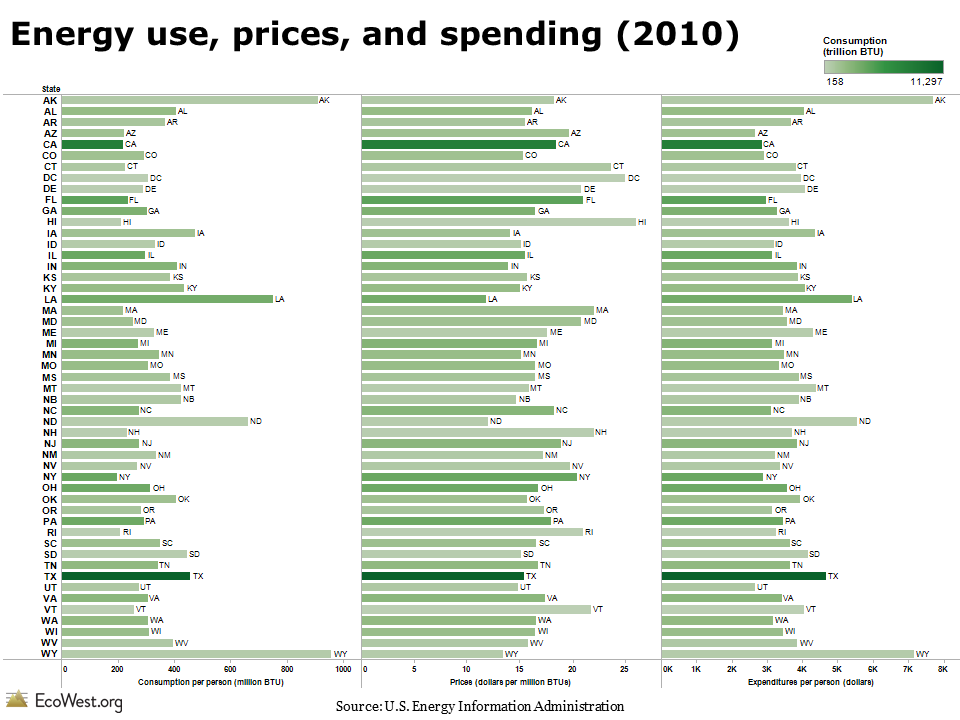
The chart below adds two more dimensions: prices and per capita spending. The bars are shaded green according to the total energy consumption in the state. I’ve sorted the states alphabetically, but on the dashboard you can order them by any of these variables.
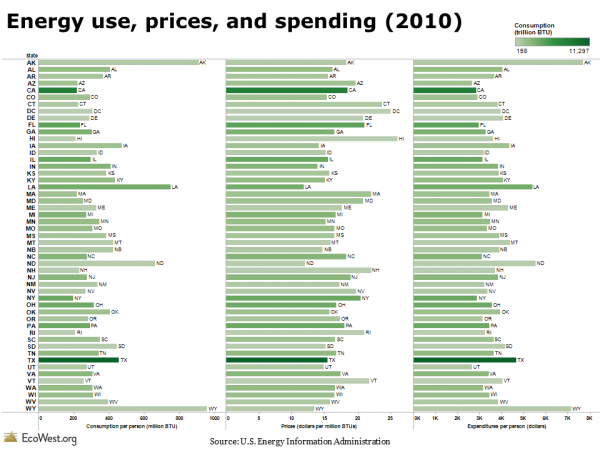
Energy use, prices and spending by state (2010)

Prices versus consumption

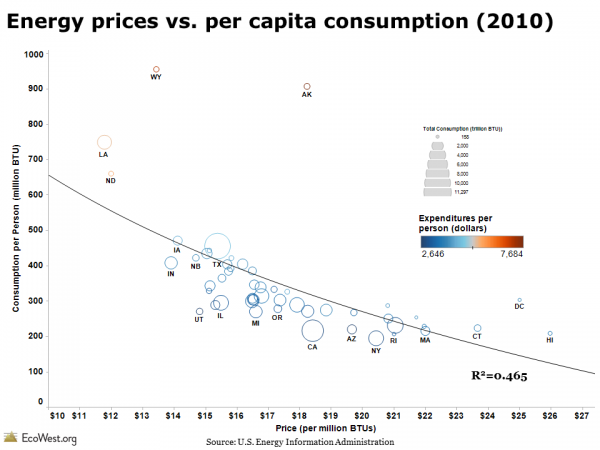
I was curious whether there was any relationship between energy consumption and prices. Economics 101 suggests higher prices could mean lower consumption. The scatter plot below shows that there is, in fact, an inverse relationship between energy prices and use. I’ve sized the circles according to the total energy consumed in the state and colored them according to per capita energy expenditures.

EcoWest State Energy Dashboard

The spread in energy consumption and prices across the 50 states is very wide. Energy prices in Hawaii and some Northeast states are double, or nearly so, the costs in Louisiana and North Dakota. Per capita consumption in New York and California is less than one-fourth the use in Alaska and Wyoming.

Once again, the four energy-producing states are outliers. Leaving aside Alaska, where prices for many commodities are high, these states have the lowest energy prices. I repeated the analysis by excluding the four states and the R2 value increased from 0.465 to 0.566, indicating a stronger correlation between price and consumption.

But correlation is not causation! Other factors, such as the local climate and travel patterns in a state, may be more important variables. Several of the states with the most expensive energy prices and lowest energy consumption are in the Northeast (e.g., Connecticut, Rhode Island, Massachusetts, New York). Prices tend to be higher in this urbanized region, which has a large population, extensive mass transit, and fewer vehicle-miles traveled. In other words, the high cost of gasoline in Manhattan is probably not the main reason why its residents drive less.

In a future post, I’ll analyze state-level data on carbon dioxide emissions.

Data sources

The energy dashboard is based on data from the U.S. Energy Information Administration’s Annual Energy Review, specifically this table.

Downloads

EcoWest’s mission is to analyze, visualize, and share data on environmental trends in the North American West. Please subscribe to our RSS feed, opt-in for email updates, follow us on Twitter, or like us on Facebook.

Viewing the Yosemite Rim Fire in context: images, maps, and graphics

The Rim Fire burning in and around Yosemite National Park is generating national headlines due to its vast size and its threats to San Francisco’s water supply, the park’s majestic sequoias, and thousands of homes.

To put this fire in context, I’ve created a few of graphics that summarize recent fire seasons in California and the national picture thus far in 2013. You can download the PowerPoint deck and data at the bottom of this post.

Views of the fire

Before getting to the data, let me first share some compelling views of the Rim Fire. The nearly 190,000-acre blaze is big enough to be visible from the orbiting International Space Station. Here’s a photo that astronaut Karen Nyberg tweeted on Monday.

Here’s a time-lapse video, posted by park staff, that shows the Rim Fire’s growth.

You should also check out this stunning video of the fire, filmed from the perspective of a C-130J air tanker making drops of retardant (I recommend fast-forwarding to 4:00). The tanker is guided to its target by a smaller lead plane, and it’s interesting to hear the chatter among the pilots. Unfortunately, they haven’t figured out how to turn off the “landing gear” audible warning.

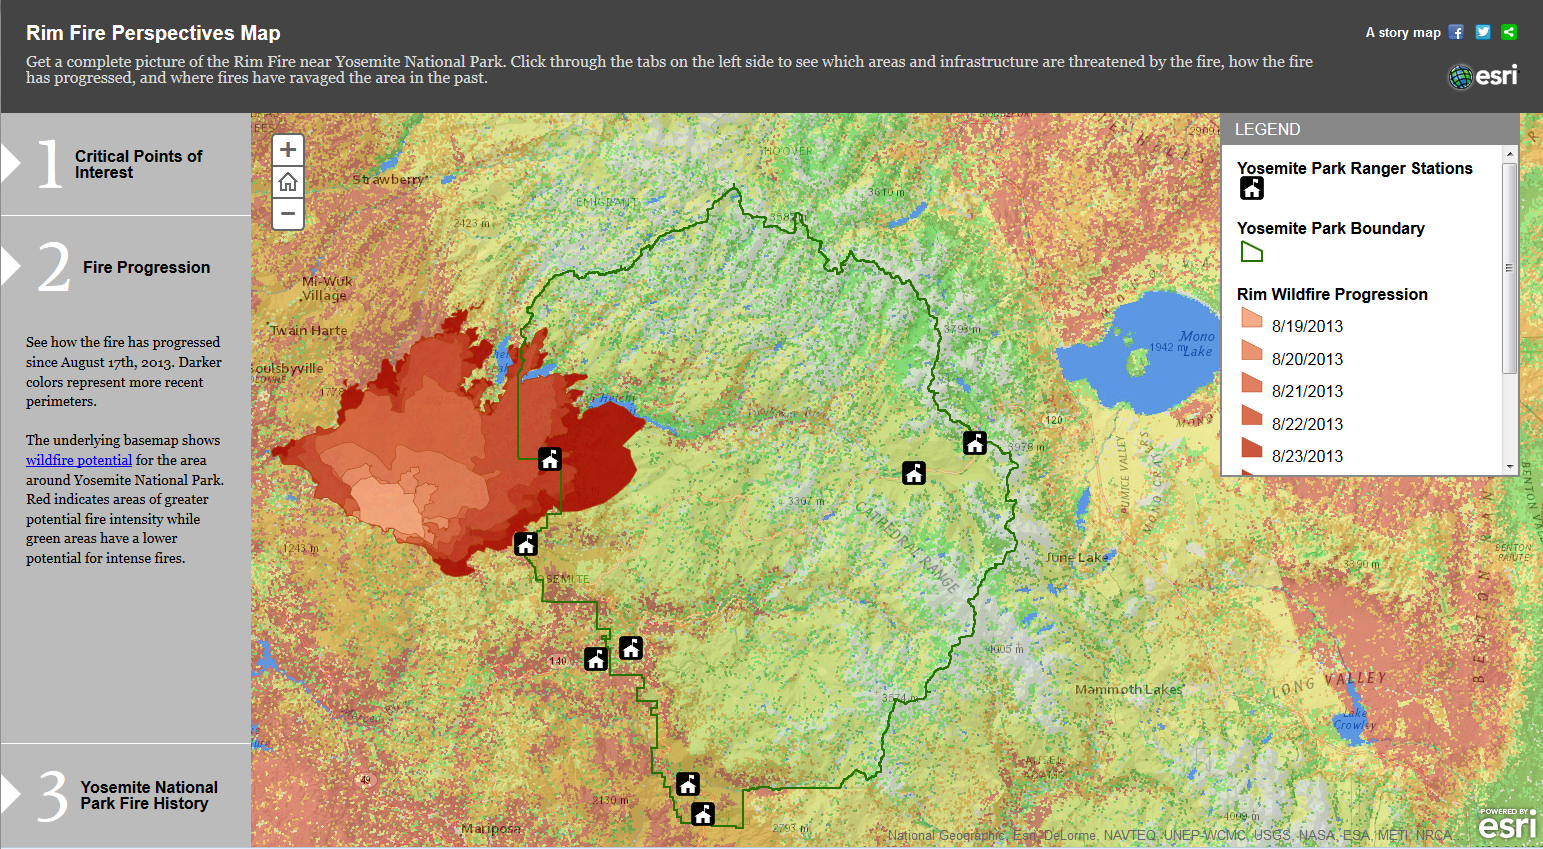
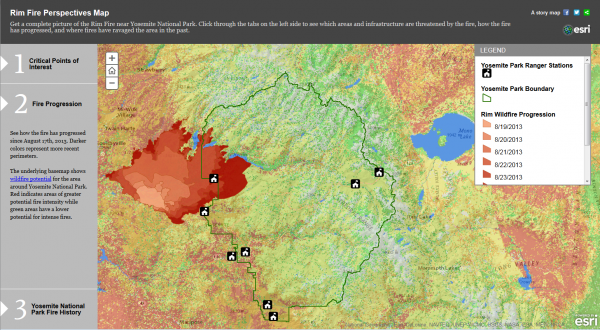
If you’re curious about the blaze’s footprint, ESRI has posted an interactive map of the Rim Fire, including its progression and perimeters of previous burns. Here’s a screen shot (click to enlarge).

esriimfire

EcoWest contributor David Kroodsma has put together an animated map of the fire’s progression.

Recent California fire history

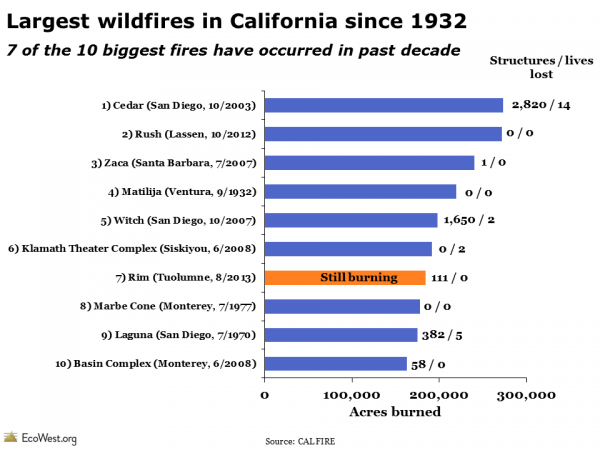
The Rim Fire is currently the seventh-largest wildfire in California’s recorded history. Cal Fire says its data goes back to 1932, and the graphic below shows that seven of the 10 largest fires have burned in the past decade.

Largest wildfires in California history

As Cal Fire notes, there were big wildfires prior to 1932, and we know from tree-ring records and other research that lightning and Native Americans would start fires that sometimes grew very large. The Rim Fire is less than a quarter contained, so it may well rise in the rankings.

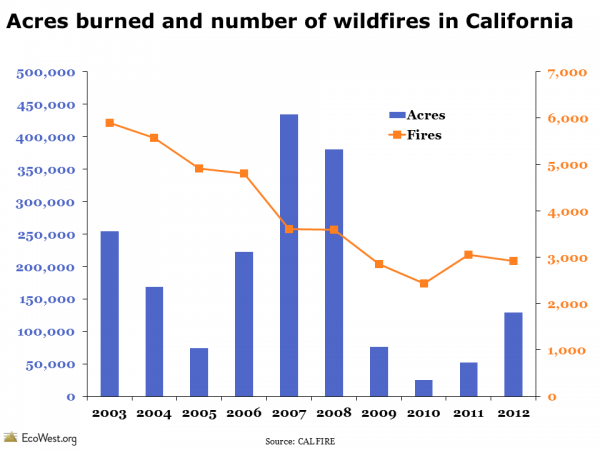
Looking back over the past decade, there has been a downward trend in the number of wildfires in California, something that isn’t seen in the national-level data. The number of acres charred by fires has varied considerably from year to year, but the previous four years were relatively tame.

California fire history

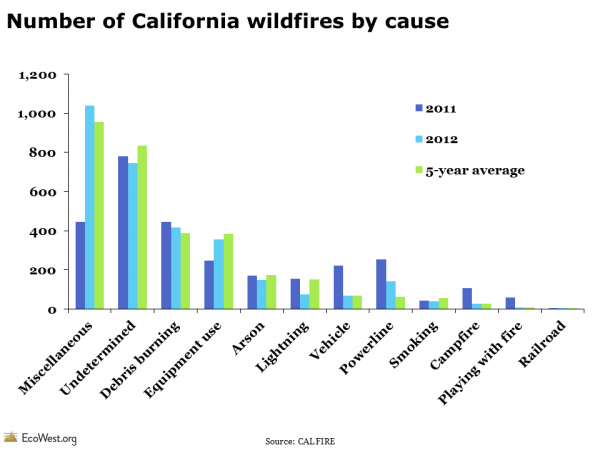
Cal Fire provides greater detail on the cause of wildfires than the National Interagency Fire Center (we present that data on this dashboard and this post). Below is a summary of wildfire ignitions in California. Lightning starts relatively few fires in the state and the cause of many blazes is never determined. The Rim Fire’s cause is under investigation.

Causes of wildfires in California

National picture: below-average fire season

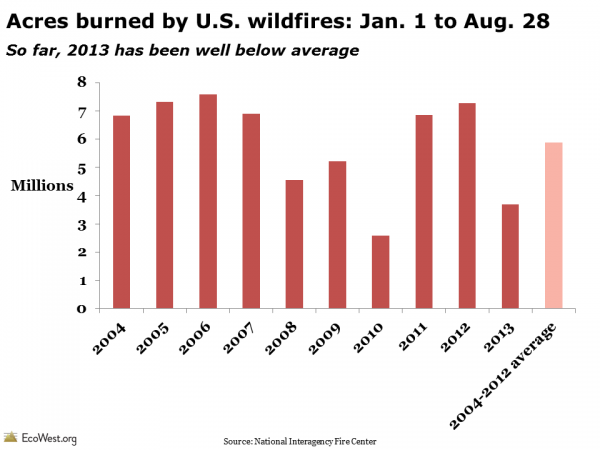
The Rim Fire and the deaths of 19 firefighters in Arizona in June will make 2013 a historic fire season, but in something of a paradox, 2013 is on track to be a below-average year for fire activity on the national level. The graphic below, based on data from the National Interagency Fire Center, shows the acreage burned each year from January 1 to August 28. So far, 2013 is the second lowest total since 2004. The 3,686,318 acres that have burned this year is just 63% of the 2004-2012 average.

2013 wildfire season to date

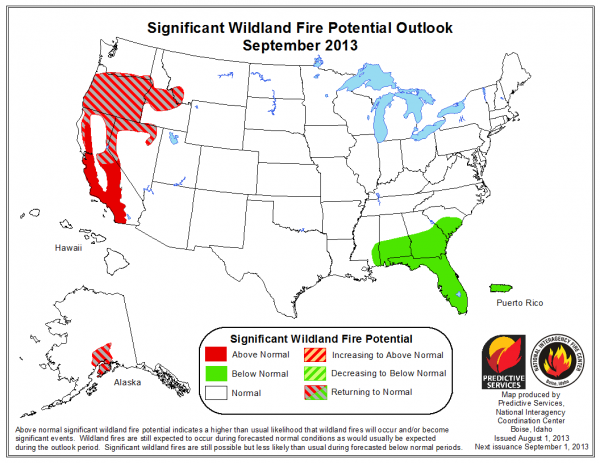
We’ve still got a way to go in the 2013 wildfire season, but many areas in the Southwest and Southern Rockies have received a good soaking over the past two months, so they are unlikely to add to the total in any big way. Going forward, the potential for large fires will be greatest in California, Nevada, Oregon, and Idaho.

Wildland fire potential outlookOverall trend: larger fires

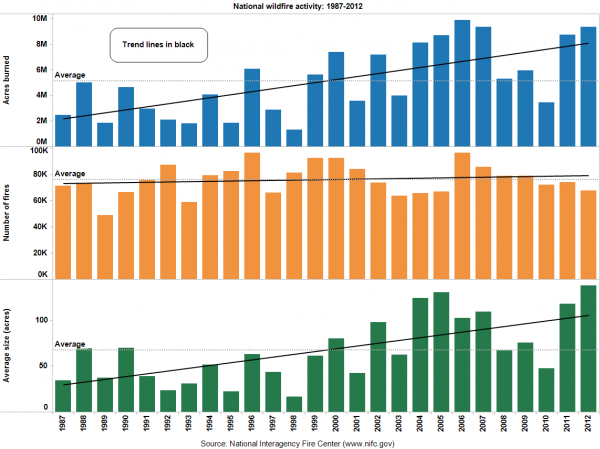
One of my main takeaways from analyzing wildfire data is that the numbers can jump around from year to year, and we shouldn’t put too much stock in any single data point. Relatively small fires can kill people and destroy hundreds of homes, while enormous blazes in wilderness settings can do wonders for ecosystems. Overall, the trend in recent years has been toward larger fires and more acres burned, as shown below.

Wildfires and acres burned: national overview since 1987

What’s not captured in these raw acreage totals is the real impact on the ground. What fraction of the landscape was nuked? How many acres are better off after a low-intensity burn? Reports from the fire lines and the imagery shared above suggest the Rim Fire is burning very intensely and could do considerable damage to the park’s resources and nearby residents’ homes.

Whatever the final acreage total, blazes like the Rim Fire are likely to become more common in the years and decades ahead, according to climate change projections. Andrew Freedman has a good discussion at Climate Central, which also provides this embeddable data visualization on Western wildfire trends.

Downloads

Data sources

Data on California fires comes from Cal Fire and its 2012 red book. The agency also has PDFs showing the largest fires in terms of acres burned and structures lost.

The National Interagency Fire Center provides year-to-date totals for fires and acres burned on this page.

EcoWest’s mission is to analyze, visualize, and share data on environmental trends in the North American West. Please subscribe to our RSS feed, opt-in for email updates, follow us on Twitter, or like us on Facebook.
Plotting “dead pool” and other watersheds for Lake Powell and Lake Mead

The elevations of Lake Powell and Lake Mead, two critical reservoirs on the Colorado River, are like the Dow and S&P 500 for water in the Southwest. These closely watched metrics serve as simple barometers and summaries of how things are going in a fiendishly complex system, be it the U.S. economy or a watershed spread across a quarter-million square miles that provides drinking water for nearly 40 million people.

“Water buffaloes,” the professionals who manage the West’s most precious resource, have been sounding bearish in recent days about Powell and Mead, the nation’s two largest reservoirs by capacity. The past 14 years have been the driest for the Colorado River in more than a century of record keeping. On Friday, federal officials announced they will cut releases from Powell from 8.23 million acre-feet to 7.48 million acre-feet, which would be lowest release since the reservoir was filling in the 1960s.

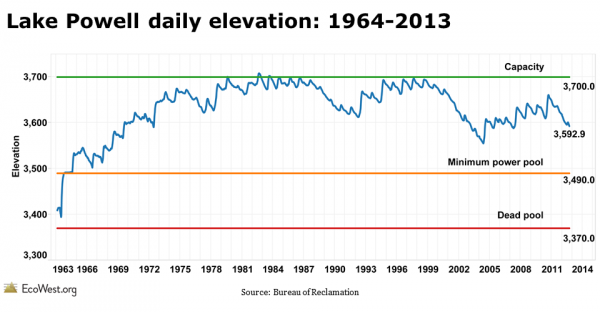
To track water storage in Powell and Mead, I’ve created a dashboard that plots the lake levels and some important benchmarks. Below are some images from the visualization (click to enlarge). There’s also a PowerPoint presentation you can download at the bottom of the post.

Lake Powell elevation graphic Lake Mead elevation graphic

Elevation benchmarks

The Powell chart plots the daily elevation and the Mead chart illustrates the July 1 level; in the former, you can see the annual ebb and flow. I used two different time scales because that’s how I found the data on the U.S. Bureau of Reclamation’s websites (separate offices manage Powell and Mead).

Capacity shows the elevation when the reservoirs are full. For Powell, raising the spillway gates can slightly increase capacity, but flooding in 1983 did nearly overtop Glen Canyon Dam. When a reservoir is at dead pool, the water level is so low that it cannot drain by gravity through the dam’s outlet works. Hydropower can only be generated when the reservoir is above the minimum power pool. For Mead, which supplies the Las Vegas metro area, the elevation of the Southern Nevada Water Authority’s lower intake is shown.

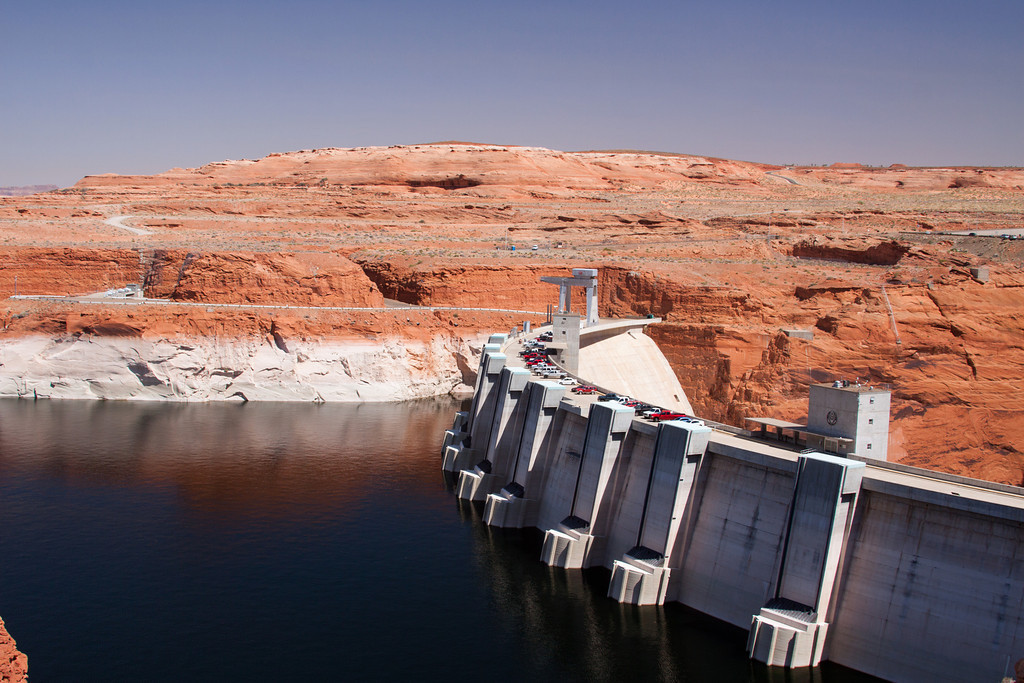
Our dashboard uses lake elevation, but in our PowerPoint deck we also have some slides showing changes in volume. Each metric tells us different things about the status of the reservoirs, but elevation is easier to visualize. Below is a photo I took last April of Powell’s so-called bathtub ring, which is even more exposed today.

Lake Powell and Glen Canyon Dam
Lake Powell and Glen Canyon Dam, April 2012. Photo by Mitch Tobin.

Satellite imagery shows Powell’s decline

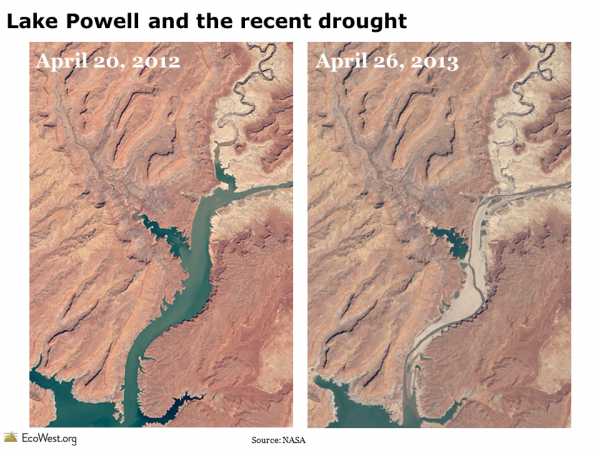
Another way to track the status of these reservoirs is by taking repeat photographs, either on Earth or from space, of the same location. Below are two views of Lake Powell, the first showing 2002 vs. 2003, and the second comparing 2012 vs. 2013, based on NASA satellite imagery.

Lake Powell drought photograph

Lake Powell satellite image drought

The PowerPoint deck that you can download below contains a time series of satellite images of Powell from 1999 to 2013. The contrast between 2012 and 2013 illustrates why federal officials are taking action and cutting releases from the reservoir.

Reservoir levels projected to fall

Looking ahead, federal water managers project that Mead will drop another eight feet in 2014 due to reduced releases from Powell. Below is a graphic from Reclamation that shows Powell is likely to keep falling as well.

Lake Powell elevation projection

Basin susceptible to megadroughts

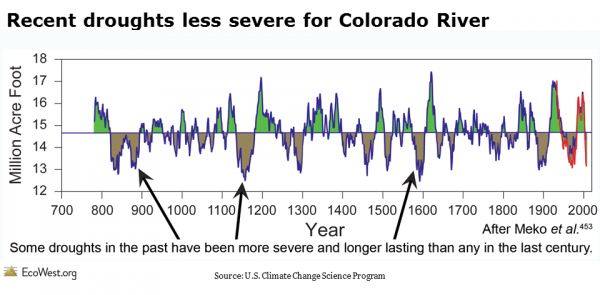
The outlook for precipitation in the basin over the next few years is uncertain, but one thing we know for sure is that the Colorado River is vulnerable to megadroughts, the likes of which we haven’t seen in modern times. The graphic below, from the U.S. Climate Change Science Program, shows the annual flow of the Colorado River over the past 1,200 years. Scientists used tree rings to estimate the river’s volume before the instrumental record, which is shown as a red line. The arrows point out that the basin has been periodically hit with megadroughts that were worse than the one we’ve been experiencing since 2000.
Colorado River drought tree ring record

Climate change expected to shrink Colorado’s flow

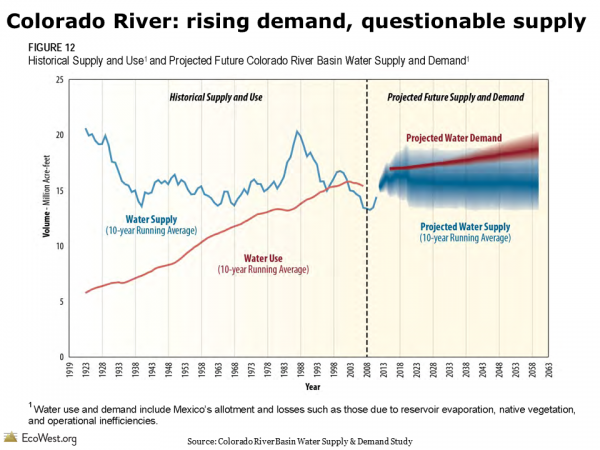
Even without considering climate change, the Colorado River would face a challenging future because the demand for its limited–and capricious–supply is increasing along with the Southwest’s population. But scientists project that even less water will flow down the river in the decades to come due to rising temperatures and altered precipitation patterns. The graphic below, from Reclamation’s recent Basin Study, shows that demand is projected to exceed supply on the river (see our earlier post for more details).

Colorado River historical and projected water use and supply

Data sources

The Bureau of Reclamation provides detailed data on Lake Powell and Lake Mead. I pulled the benchmark levels from this Reclamation presentation, specifically page 15.

If you’re keeping score at home, the capacity of elevation of Powell is listed as 3,700 feet, but during floods the reservoir’s elevation can go slightly above this level by raising the spillway gates. In 1983, Powell reached an all-time high elevation of 3,708.34 feet.

The decision to cut releases from Powell was covered by The Arizona Republic,  National Public Radio, and The Salt Lake Tribune, among others.

Downloads

EcoWest’s mission is to analyze, visualize, and share data on environmental trends in the North American West. Please subscribe to our RSS feed, opt-in for email updates, follow us on Twitter, or like us on Facebook.