Category Archives: Wildfires

The fuels dilemma and Western wildfires

When I was getting certified as a wildland firefighter in 2002, they taught us that fire behavior is based on three basic factors.

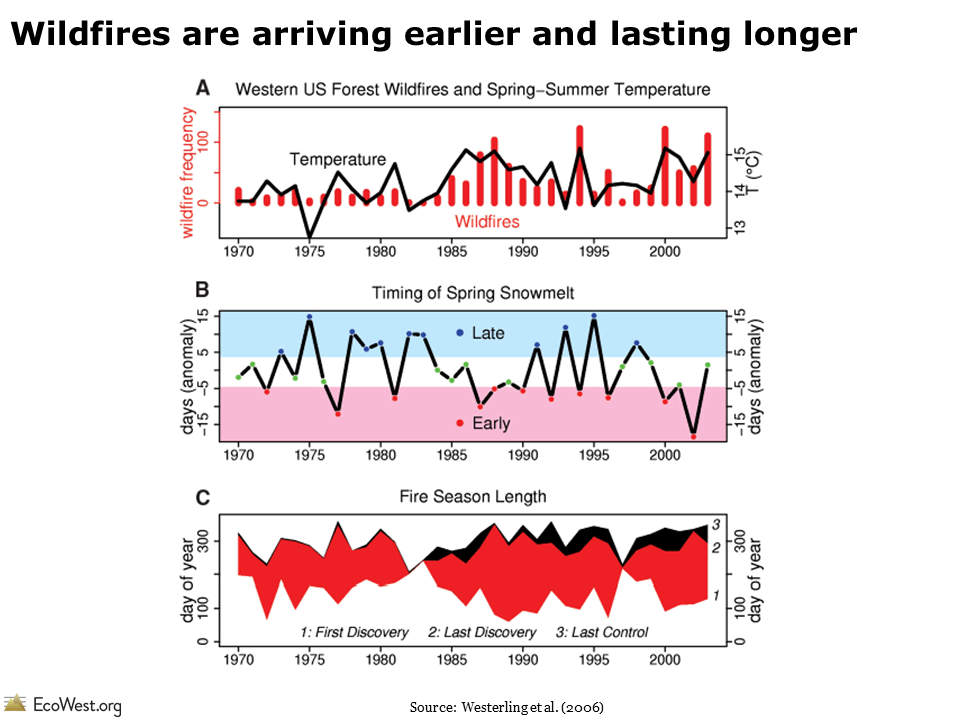
First, weather: not just the temperature, humidity, and wind at that moment, but also the climatic conditions over the preceding months and years. All else equal, if it’s hot, dry, windy, and you’re in a drought, you’d expect more extreme fire behavior.

Second, topography: drafty canyons, south-facing slopes exposed to the desiccating sun, and other natural features can encourage burning. Fire travels faster uphill, our instructors cautioned us, but firefighters move slower.

Third, fuels: the type of vegetation, its volume, its moisture content, and its continuity on the landscape. As a fire travels from grasslands to woodlands to dense forests, its personality can change radically.

The first two factors–weather and topography–are out of our control, putting aside the fact that we are changing the weather via climate change and loading the dice toward more fire-friendly conditions in the American West.

What we can directly influence are the fuels. We can break the natural cycle of wildfires by suppressing both human- and lighting-caused blazes, allowing the fuel to build up. We can mechanically thin and intentionally burn areas to reduce the amount of fuel available to future wildfires. We can go so far as to cut down all the trees and pave over a place, thereby eliminating the possibility of a wildfire (or a natural ecosystem).

Tracking fuels treatment to tame Western wildfires from EcoWest on Vimeo.

Fuels dilemma

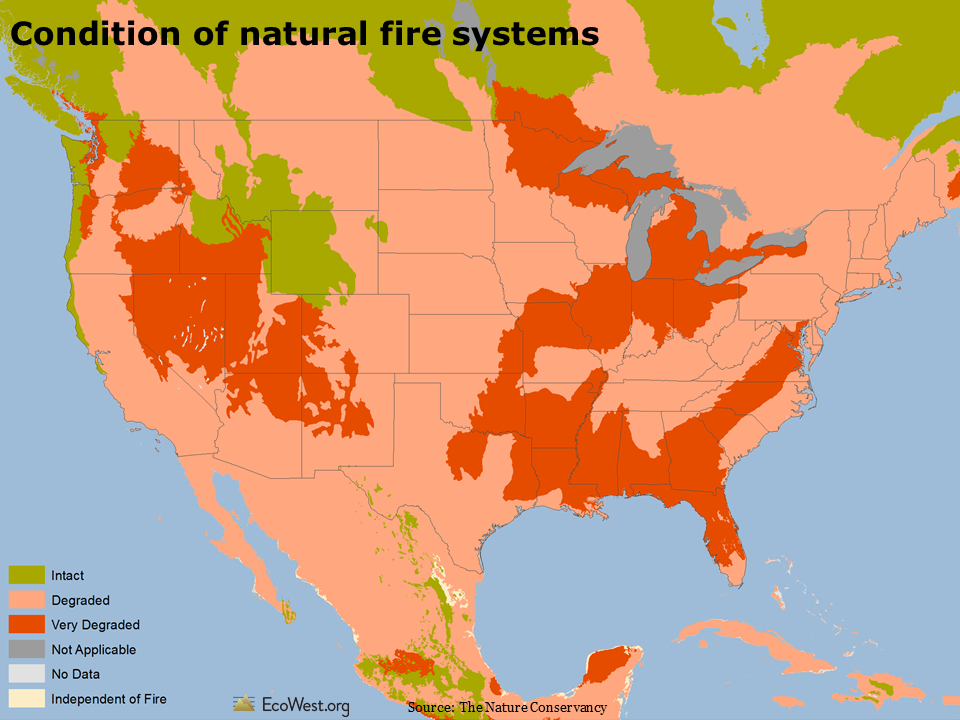
Today, the American West is facing a fuels dilemma. The graphic below shows the condition of fire regimes across the country. Red illustrates areas where wildfires may be significantly altered from their historic behavior, yellow shows areas that are moderately altered from historic conditions, and green marks where conditions are near historical norms. This data is from 2000, but things probably haven’t changed much since then.

Fire regime: departure from historic conditions

I’ve created slides like these to describe the fuels dilemma in a PowerPoint you can download at the bottom of this post. The presentation explains how the policy of fire suppression has disrupted the natural fire regime in many parts of the West. I’ve also analyzed federal statistics on the number of acres thinned and burned, both in the slide deck and on this dashboard page, but the government’s reporting on fuels treatment is lacking and I’m still in search of better data to characterize this crucial issue.

Fuels treatment

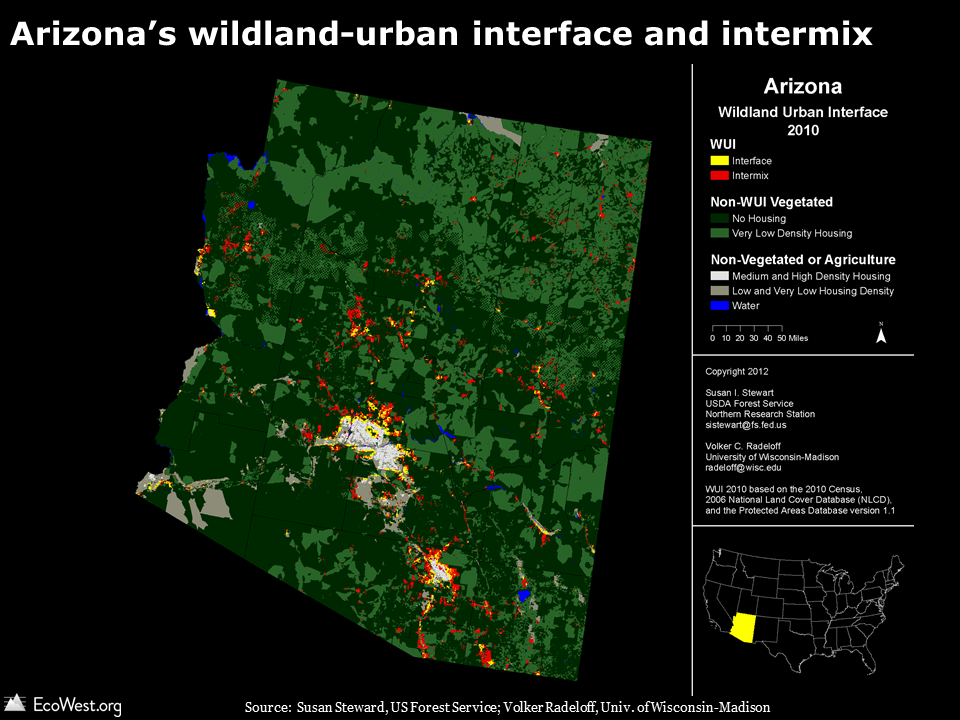
The graphic below distinguishes between a couple of different types of fuels treatment. The first distinction is between activity taking place within and beyond the wildland-urban interface. Known by its acronym, the WUI is where property and residents are at greatest risk of wildfires. The second distinction is between thinning with chainsaws (“mechanical”) and prescribed burns (“fire”).

Fuels treatment on federal lands

The total acreage has been climbing in recent years, but the government only reports this data through 2009. I haven’t been able to find anything more current, but would welcome any suggestions from readers. The data source appears to have been created as part of the George W. Bush administration’s Healthy Forests Initiative but not continued by Barack Obama’s administration.

As of 2009, the federal government was treating an increasing number of acres, but it’s critical to remember that these totals are small relative to the size of the problem. Some 190 million acres of federal land face an elevated risk of catastrophic wildfire, according to one widely used estimate from the U.S. Forest Service (see here for technical report).

I was also struck by the considerable amount of thinning taking place outside of the WUI. Proposals to cut down brush and trees right around vulnerable communities often have the backing of environmental groups, but as these thinning projects move farther into the backcountry, they tend to face more opposition, especially if sizable timber harvesting is part of the equation.

Prescribed burns

On a per acre basis, prescribed fires are much less expensive than mechanical thinning projects, but conditions have to be just right to set a prescribed fire so that it doesn’t turn into a disastrous wildfire. That’s happened occasionally in the West, such as the 2000 Cerro Grande Fire in New Mexico and the 2012 Lower North Fork Fire in Colorado that killed three people. Many in the public remain skeptical or outright opposed to prescribed burns because of the risks and smoke.

The graphic below shows that the number of acres burned in prescribed fires was increasing for a while, but the national total is just a couple million acres annually. (This time series, from the National Interagency Fire Center, is part of their annual report and looks like it will continue.)

Acres burned in prescribed fires

Wildland-fire use

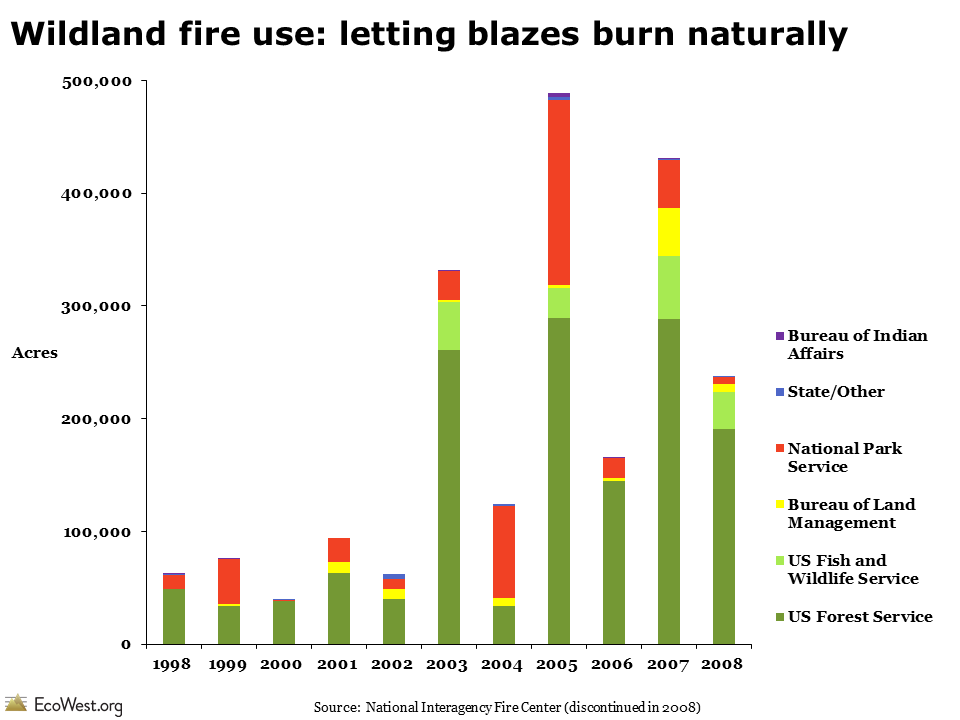
The federal government used to report on instances of “wildland fire use,” essentially letting wildfires burn rather than suppressing them. This strategy is still practiced today when fires are in a wilderness or other remote area and not posing a significant threat to property and people. The graphic below shows the number of acres burned in these types of fires, by agency, but the feds stopped reporting this statistic in 2008.

Acres burned in wildland fire use

Looking ahead

In places like the Southwest, there’s pretty broad agreement among scientists, land managers, firefighters, and conservation groups that additional thinning in the WUI and increased prescribed burns could mitigate–but not eliminate–the risks of catastrophic fires destroying homes. The data I’ve found suggest there’s been a slight upward trend in such fuel treatments, but the overall totals are small and are likely to remain so in a time of fiscal austerity. Letting nature do the work for us would obviously be less expensive, even ecologically preferable, but the proliferation of homes in fire-prone landscapes has made fire suppression an imperative across much of the West.

Sources

Data on thinning comes from this report, part of a cooperative effort between the Interior and Agriculture departments. The information on prescribed burns and wildland fire use are from the National Interagency Fire Center.

This story from HowStuffWorks has a good discussion of the three key factors that explain fire behavior.

The Yarnell Fire disaster has generated some solid coverage of the wildfire issue. See this piece by Felicity Barringer of The New York Times on the rising number of homes in the WUI and this op-ed in the Arizona Republic by Don Falk of the University of Arizona. I’m quoted briefly in this story by Amanda Paulson in the Christian Science Monitor.

Downloads

EcoWest’s mission is to analyze, visualize, and share data on environmental trends in the North American West. Please subscribe to our RSS feed, opt-in for email updates, follow us on Twitter, or like us on Facebook.

Counting homes in the Western WUI

When firefighters are deployed to battle wildfires, they often focus on saving structures in the wildland-urban interface (WUI), where homes mix with or border flammable vegetation.

Where are these vulnerable homes located in the West?

Data from analytics firm CoreLogic provide a good high-level overview of the Western WUI. I’ve created a dashboard on this page to summarize their numbers.

CoreLogic uses four categorizes to describe the risk of wildfires destroying residential properties: very high, high, moderate, and low. There are also categories for agricultural and urban properties, which are not rated for their fire danger.

In the 13 Western states it analyzed, CoreLogic found some 740,000 residences at high or very high risk for wildfire damage and those homes are valued at more than $136 billion. Nearly 168,000 homes, valued at more than $32 billion, are in the very high risk category.

Geographic disparities

Below are a couple of views of the data (click to enlarge). The map shows the number of homes in the very high risk category, with the circles colored by the percent of homes in each state that are in this most vulnerable category. You can see that California and Colorado both have nearly 50,000 homes in this category, but while that’s about 3 percent of Colorado’s residential properties, it’s just 0.5 percent of California’s. The bar chart shows what percent of each state’s homes are in the very high and high categories.

EcoWest WUI homes dashboard

New Mexico, Montana, and Colorado have the highest percentages of homes in the top-two risk categories. Below is another visualization of the data, which just focuses on the very high risk category.

Number of residential properties facing very high risk

Comparing average home values

CoreLogic also provides data on the value of the residential properties in each of the risk categories. I divided these values by the number of homes in each category to create an average value figure, which is presented below in a scatter plot.

In this graphic, I’m comparing the very high risk to the low risk homes. The circles vary in size by the number of homes in the very high risk category and they’re colored to show the percent of homes in a state that are in this most vulnerable subset. If a state is above the 45-degree line, its very high risk properties are more valuable, on average, than the low risk homes, and vice versa.

Comparing values of properties in Western WUI

This scatter plot shows that in plenty of Western states, homes in the riskiest and least risky categorize have roughly the same average value (they fall on or close to the 45-degree line). But in Nevada, the very high risk homes have an average value of about $325,000, while the lowest risk houses have an average value of about $165,000. The spread of the circles also indicates that there’s great state-to-state variation in home values. Colorado’s very high risk properties, for example, are more than twice as valuable as those in Texas.

CoreLogic sells much more detailed information on risk to insurance companies, but these state-level figures still show some interesting geographic patterns. California, Colorado, and Texas have the most homes in the WUI, while Washington, Wyoming, Nevada, Utah, and Oklahoma have very few.

Here’s more from CoreLogic and Dr. Howard Botts, its vice president and director of database development:

The Wildland Urban Interface (WUI) identifies the intersection of potentially high-risk fire areas and large numbers of homes. The report states that just between the years of 1990 to 2008, there were close to 17 million new homes built in the U.S., of which 10 million (58 percent) were located in the WUI and therefore potentially located near high wildfire risk zones. “Homes located within a city boundary are not safe from the threat of wildfire destruction. In fact, the unprecedented growth of urban areas over the past 50 years has generally increased the likelihood homes will be damaged by wildfire activity,” said Botts. “As residential development has expanded into formerly undeveloped wildlands, the transitional area between the two, known as the Wildfire Urban Interface, has become exceptionally vulnerable to wildfire. Approximately 40 percent of homes in the U.S. are located in that zone, and wind-blown embers are capable of igniting homes located hundreds, or even thousands of feet away from an actual fire.”

I’d be curious if readers see any other patterns in the data, which is available for download below. We have a gallery of state-by-state WUI maps and some more discussion of the issue in this post.

NOTE: I’m about to head off on vacation, so EcoWest will resume with new posts the week of July 15.

Downloads

EcoWest’s mission is to analyze, visualize, and share data on environmental trends in the North American West. Please subscribe to our RSS feed, opt-in for email updates, follow us on Twitter, or like us on Facebook.

Arizona firefighter disaster could be pivotal moment

The shocking deaths of 19 firefighters yesterday in Arizona is a grim milestone in the history of wildland firefighting. Will the Yarnell Hill Fire also be a watershed event in how this nation approaches wildfires?

Sadly, it often takes a national tragedy to raise awareness of problems and force action on solutions.

We know wildfires are getting larger, more people are living in the fire-prone wildland-urban interface (WUI), and climate change will only make the problem worse.

What remains to be seen is whether the disaster will lead to changes in how the nation approaches the wildfire issue. Will it lead to more funding for hazardous fuels reduction and prescribed burns? Will it spur more regulations on development and building practices in the WUI? Will it change how wildland firefighters do their work and make fire managers more risk averse?

A historic tragedy

Looking back over the past century, I think the Yarnell Hill Fire ranks up there with the Great Fire of 1910 (see Stephen Pyne’s Year of the Fires  and Timothy Egan’s The Big Burn) and the Yellowstone Fires of 1988 (see Rocky Barker’s Scorched Earth) as defining moments in the history of U.S. wildfires. The 1910 inferno led to a massive increase in fire suppression; the Yellowstone blazes resulted in greater appreciation of fire’s benefits for many Western ecosystems.

The loss of 19 firefighters in one incident is actually a historic event for all of U.S. firefighting, not just the wildland form. It’s the greatest loss of life since 9/11 and it’s tied for sixth on the all-time list. Notice in the graphic below that almost all of these incidents happened decades ago (this data, from the National Fire Protection Association, has slightly different numbers for wildfire deaths than what the National Interagency Fire Center reports).

Deadliest incidents for U.S. firefighters

A growing problem

While the details from yesterday’s burnover are just emerging, we’ve known for many years that a tragedy like this could happen. We’ve had so many bad wildfires over the past decade or so that it seems the American public and media have become desensitized to hearing that hundreds of homes have been destroyed or hundreds of thousands of acres are ablaze.

The loss of 19 firefighters, however, is anything but normal and hard to ignore. The cynic in me says it may take a huge civilian death toll to really elevate the issue in the national consciousness.

Here are four of the key points that emerged from our research on wildfires:

1)      Wildfires are generally getting bigger

The graphic below shows an upward trend in the average size of U.S. wildfires since 1990. This is very high-level national data, but in another post we provide more detail on the increasing size and intensity of wildfires in the West.

Average size of U.S. wildfires

2) Many fire-prone ecosystems are out of whack

Decades of fire suppression in forests, woodlands, and grasslands that frequently burned under natural conditions has led to an excess of fuel in some areas. The map below shows that the natural cycle has been degraded in nearly all U.S. ecoregions, according to an analysis by The Nature Conservancy.

Condition of natural fire systems

3) More people are living in vulnerable wildland-urban interface

The map below shows where homes are most at risk from wildfires in Arizona. As the West’s population has risen, so has the number of people living in these higher-risk areas. Learn more about the WUI in this post.

Arizona WUI map

4) Climate change will exacerbate problem

Scientists have already found that the warming experienced over the past few decades in the West has led to an increase in wildfire activity. A 2006 paper in Science (graphic below) concluded that “large wildfire activity increased suddenly and markedly” starting in the mid-1980s, with most of the change due to a warming climate rather than fire suppression. Higher temperatures led to a thinner snowpack that melted earlier in spring, leading to more-flammable conditions in summer and a lengthening of the wildfire season by an average of 78 days.

Westerling et al graphic

We have more analysis and data on our main fire page and on dashboards that cover fire trends, suppression, firefighters, ignition, fuels, and the WUI.

Wildfire metrics send a clear signal that this problem is getting worse, especially in places like Arizona, but solutions are anything but simple. There’s no quick fix for forests and woodlands that are ecologically out of balance due to a century of fire suppression. There are already millions of homes in vulnerable locations and only so much that homeowners can do. Some local communities have taken big strides toward reducing their vulnerability and discouraged building in the WUI, but there is political resistance in the West to statewide mandates.

Fighting wildfires will always be an inherently perilous business, but perhaps the Yarnell Hill disaster will force the public and policymakers to confront this increasingly dangerous issue, evaluate the options, and take action.

Downloads

EcoWest’s mission is to analyze, visualize, and share data on environmental trends in the North American West. Please subscribe to our RSS feed, opt-in for email updates, follow us on Twitter, or like us on Facebook.